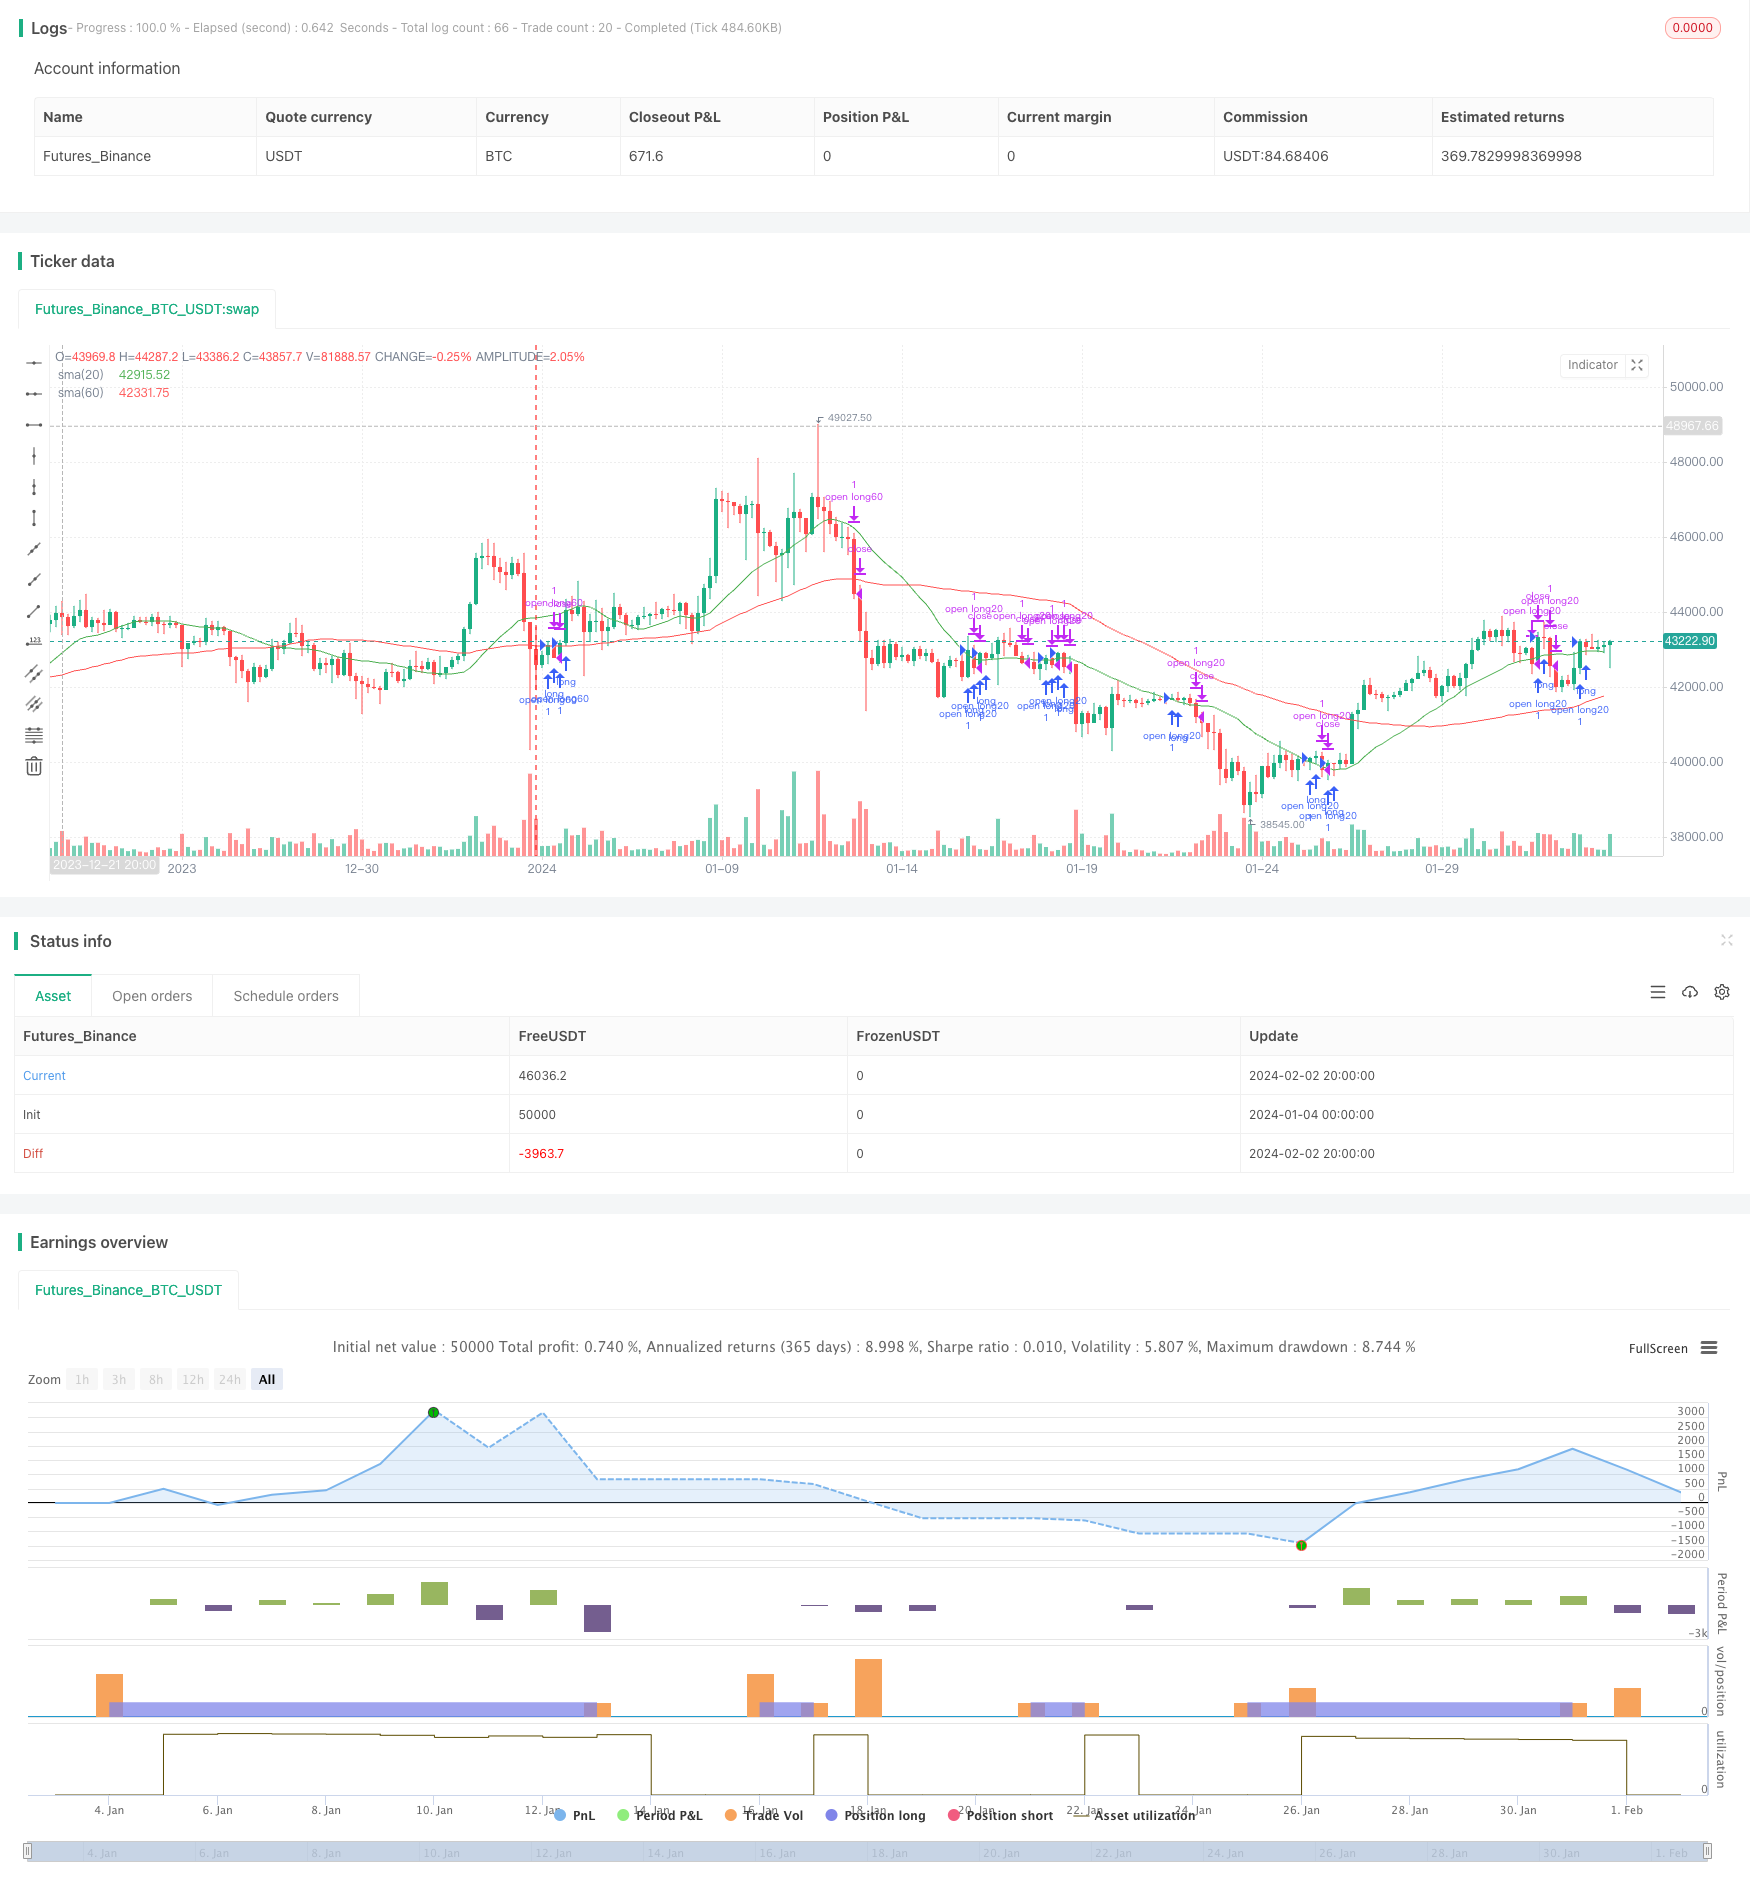
概述
双均线突破策略是一种比较典型的跟踪趋势的量化交易策略。该策略通过计算不同周期的简单移动平均线,并设置交易信号为价格突破移动平均线来判断持仓。本策略采用20日线和60日线作为交易信号。
策略原理
双均线突破策略的核心逻辑是使用不同周期的移动平均线来捕捉价格趋势,并在价格突破移动平均线时发出交易信号。
具体来说,本策略中采用了20日简单移动平均线和60日简单移动平均线。这两个移动平均线分别可以看作是捕捉短期趋势和中长期趋势的工具。当短期价格突破中长期价格时,代表着目前处于上升趋势,应该做多;当短期价格跌破中长期价格时,代表着目前处于下降趋势,应该减持头寸。
代码中通过ta.crossover和ta.crossunder来判定价格是否突破或跌破某条移动平均线。当发生突破时,就发出做多或减仓的指令。
策略优势
双均线突破策略具有以下几个优势:
- 概念简单,容易理解和实现。
- 可以有效跟踪市场趋势,避免被噪音影响。
- 策略参数少,容易优化。
- 可灵活选择移动平均线周期,调整对市场的敏感度。
策略风险
双均线突破策略也存在一些风险:
- 当市场处于震荡趋势时,会产生多次错误信号。可通过增加持仓周期来缓解。
- 无法有效捕捉快速反转的市场。可结合其他指标作为过滤器。
- 移动平均线 inherently lagging,无法提前反应价格变化。可适当缩短周期改善。
策略优化方向
双均线突破策略可从以下几个维度进行优化:
- 优化移动平均线的周期参数,找到最佳参数组合。
- 增加其他指标判断来避免错误信号。例如MACD,KD等。
- 增加止损逻辑。
- 结合更多时间周期分析,实现多时间框架。
总结
双均线突破策略是一个简单实用的趋势跟踪策略。它可以有效捕捉中长期趋势,而避开短期市场噪音的干扰。同时策略容易理解和实现,参数寥寥可数,非常适合量化交易的要求。当然,策略也存在一些改进空间,可以从优化参数、增加信号过滤和止损逻辑等方面进行提升,使得策略更加稳定和利润更高。
策略源码
/*backtest
start: 2024-01-04 00:00:00
end: 2024-02-03 00:00:00
period: 4h
basePeriod: 15m
exchanges: [{"eid":"Futures_Binance","currency":"BTC_USDT"}]
*/

// This source code is subject to the terms of the Mozilla Public License 2.0 at https://mozilla.org/MPL/2.0/
// © Astorhsu

//@version=5
strategy("Astor SMA20/60", overlay=true)
backtest_year = input(2018, title='backtest_year') //回測開始年分
backtest_month = input.int(01, title='backtest_month', minval=1, maxval=12) //回測開始月份
backtest_day = input.int(01, title='backtest_day', minval=1, maxval=31)  //回測開始日期
start_time = timestamp(backtest_year, backtest_month, backtest_day, 00, 00)  //回測開始的時間函數

//Indicators
sma10 = ta.sma(close,10)
sma20 = ta.sma(close,20)
sma60 = ta.sma(close,60)
plot(sma20, color=color.green, title="sma(20)")
plot(sma60, color=color.red, title="sma(60)")

//進場條件
// trend1 = sma60 > sma20 //假設目前趨勢為60>20
longCondition = ta.crossover(close, ta.sma(close, 20))
if (longCondition)
    strategy.entry("open long20", strategy.long, qty=1, comment="站上m20做多")


shortCondition = ta.crossunder(close, ta.sma(close, 20))
if (shortCondition)
    strategy.close("open long20",comment="跌破m20平倉", qty=1)

longCondition1 = ta.crossover(close, ta.sma(close, 60))
if (longCondition1)
    strategy.entry("open long60", strategy.long, qty=1, comment="站上m60做多")


shortCondition1 = ta.crossunder(close, ta.sma(close, 60))
if (shortCondition1)
    strategy.close("open long60",comment="跌破m60平倉", qty=1)

// longCondition2 = ta.crossover(close, ta.sma(close, 10))
// if (longCondition2)
//     strategy.entry("open long10", strategy.long, qty=1, comment="站上m10做多")


// shortCondition2 = ta.crossunder(close, ta.sma(close, 10))
// if (shortCondition2)
//     strategy.close("open long10",comment="跌破m10平倉", qty=1)