概述
本文介绍了一种基于抛物线止损转向(Parabolic SAR)指标的动量反转跟踪策略。该策略利用 Parabolic SAR 指标识别 Nifty 期货市场中的潜在趋势反转,实现自动化的趋势跟踪交易。
该策略主要适用于偏好系统化交易方法的交易者,它提供清晰的入市和出市信号。通过捕捉市场趋势,该策略有助于实现交易者的财务目标。
策略原理
该策略使用 Parabolic SAR 指标判断价格趋势方向。在看涨趋势中,SAR 值在价格突破之下,并随着新高点的出现而逐步上移;在看跌趋势中,SAR 值在价格突破之上,并随着新低点的出现而逐步下移。
当 SAR 值上穿或下穿价格时,表示潜在的趋势反转,该策略会相应地做空或做多以捕捉新的趋势方向。
具体来说,在初始计算出当前 SAR 值和加速因子后,策略持续追踪价格新高或新低,并相应调整 SAR 值。在获确认的K线上,如果是看涨趋势则在 SAR 值下方做空;如果是看跌趋势则在 SAR 值上方做多。
策略优势分析
- 使用经典指标 Parabolic SAR 捕捉市场反转
- 提供清晰的系统化入市和出市信号
- 有助于跟踪趋势,获取额外的价格移动
- 自动化交易系统,无需人工决策
风险分析
- SAR 指标并非百分之百可靠,可能出现错误信号
- 反转失败可能导致止损
- 需要考虑合约到期时间对策略的影响
- 需要考虑交易成本对策略盈利能力的影响
策略优化方向
- 优化 SAR 指标参数(步长、初始值、最大值等)
- 结合其他反转信号指标(如 RSI、MACD 等)判断反转
- 增加条件逻辑(交易量等)过滤错误信号
- 考虑调整固定止损为追踪止损
- 考虑自动调整仓位规模
总结
该策略提供了一种利用 Parabolic SAR 指标自动化捕捉市场趋势反转的交易系统。它为交易决策提供了清晰的入市出市信号,有助于跟踪趋势获利。但同时也需要考虑指标错误信号、止损风险等问题。通过持续优化,该策略有望成为一种可靠的趋势跟踪方法。
策略源码
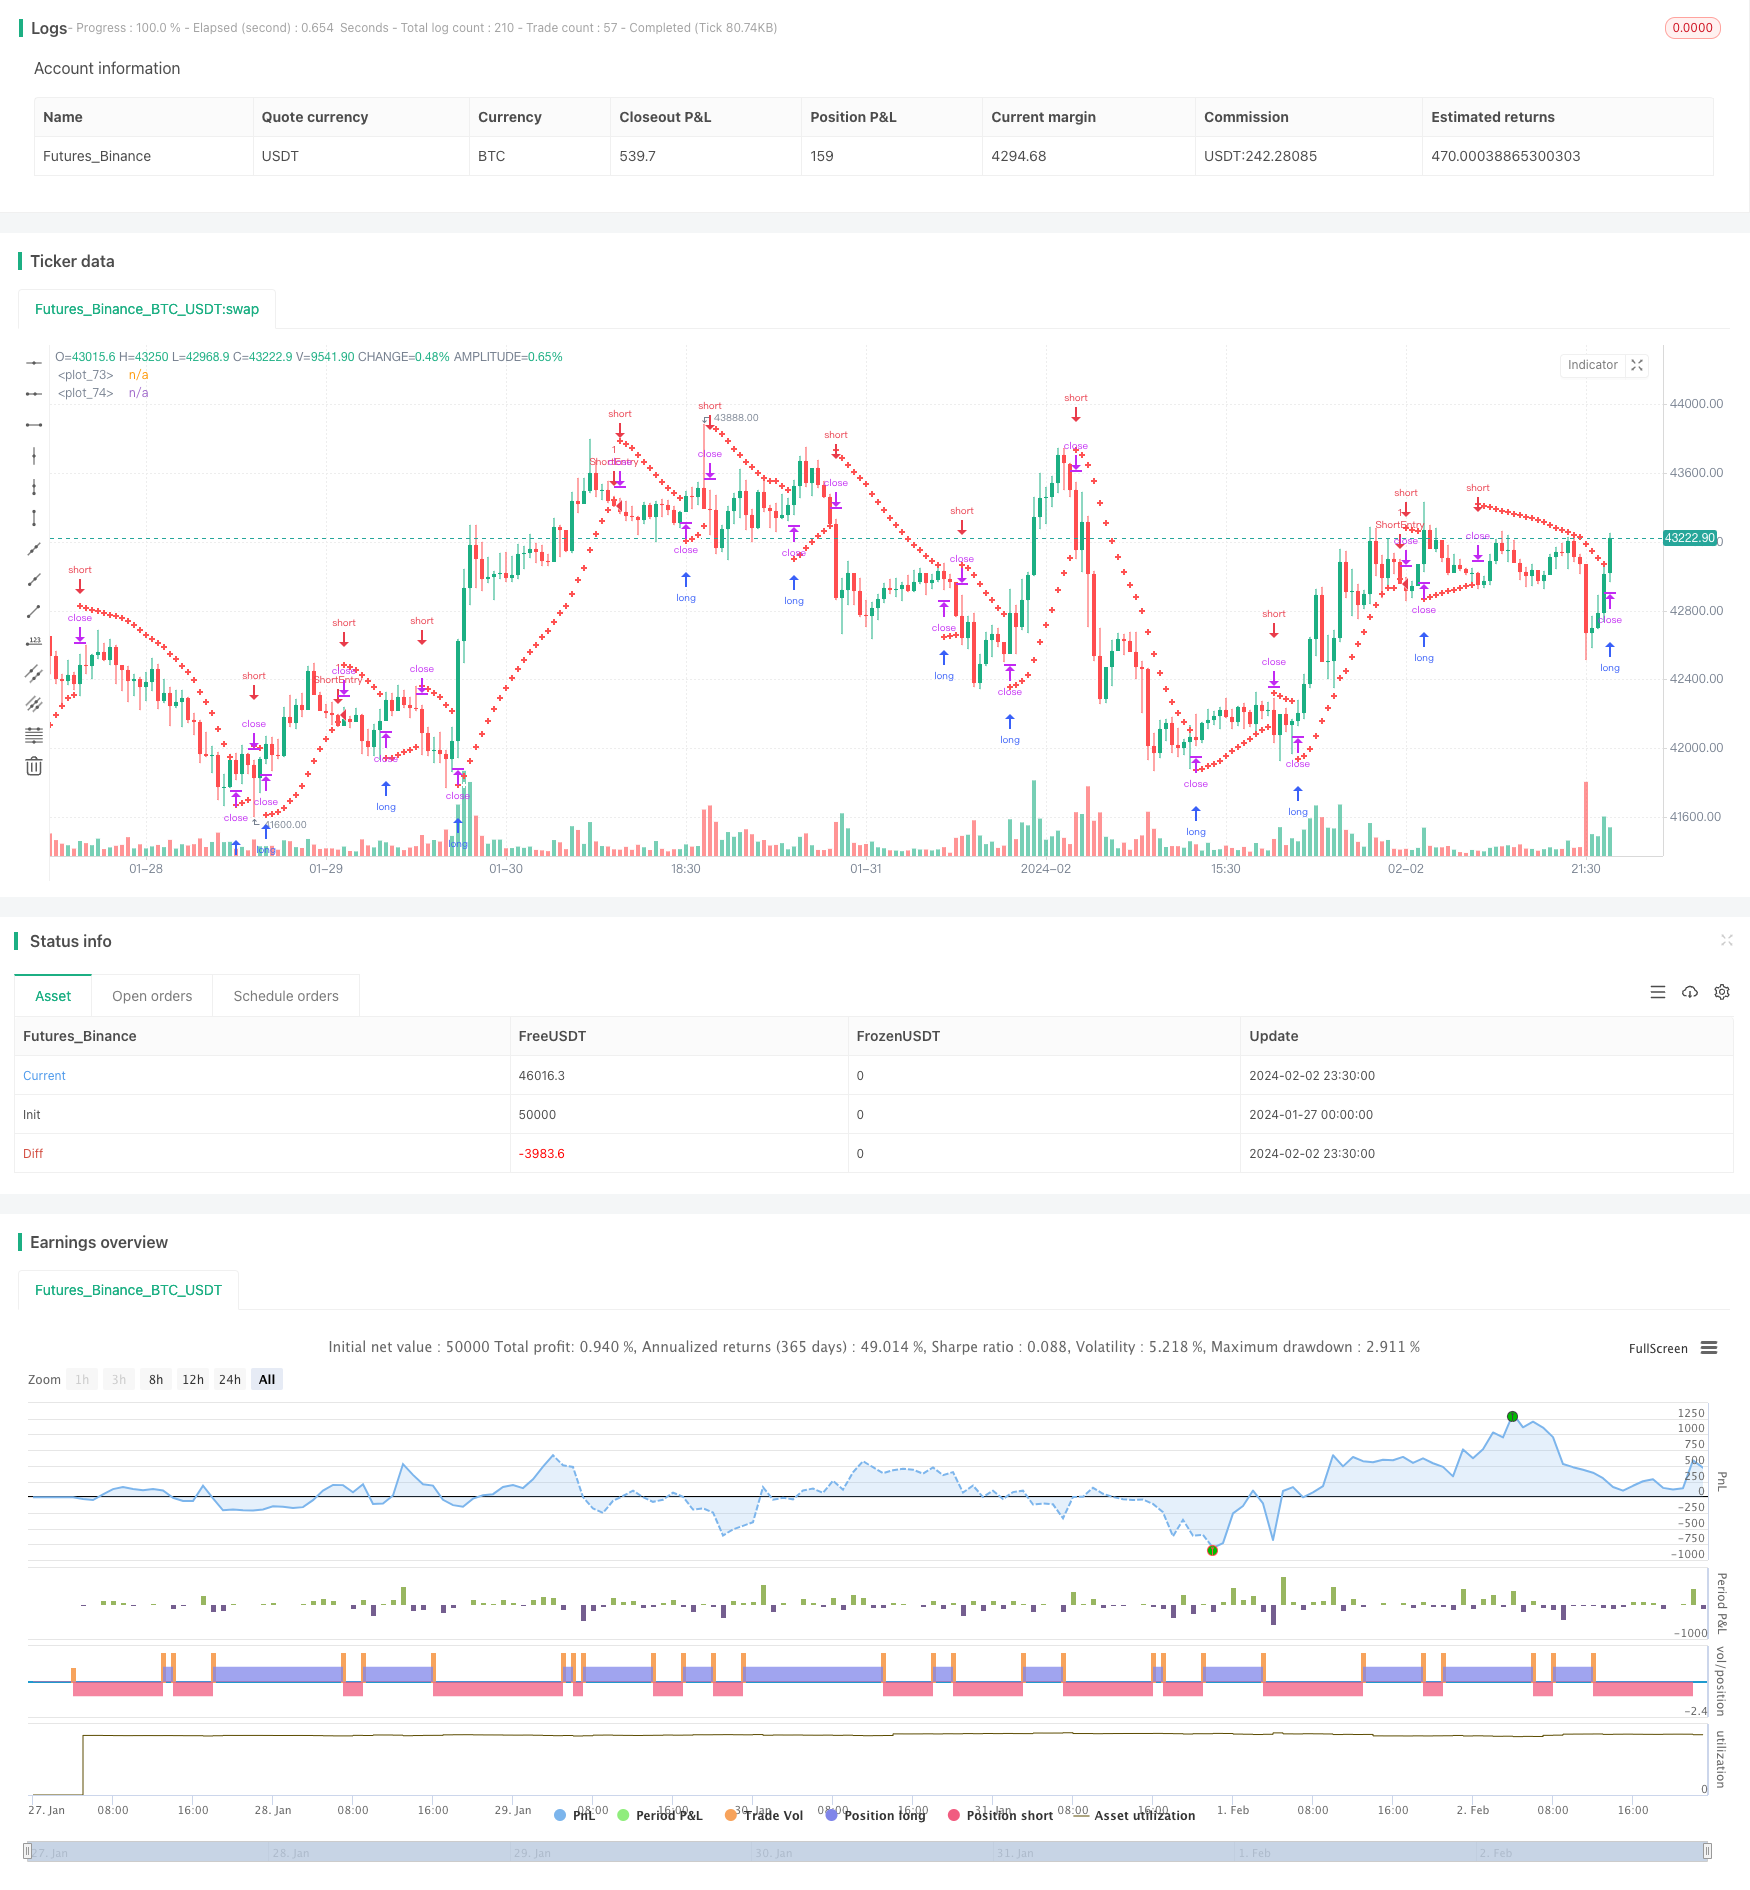
/*backtest
start: 2024-01-27 00:00:00
end: 2024-02-03 00:00:00
period: 30m
basePeriod: 15m
exchanges: [{"eid":"Futures_Binance","currency":"BTC_USDT"}]
*/

//@version=5
strategy("Positional Parabolic SAR Strategy", overlay=true)
initial = input(0.02)
step = input(0.02)
cap = input(0.2)
var bool isUptrend = na
var float Extremum = na
var float SARValue = na
var float Accelerator = initial
var float futureSAR = na

if bar_index > 0
    isNewTrendBar = false
    SARValue := futureSAR
    if bar_index == 1
        float pastSAR = na
        float pastExtremum = na
        previousLow = low[1]
        previousHigh = high[1]
        currentClose = close
        pastClose = close[1]
        if currentClose > pastClose
            isUptrend := true
            Extremum := high
            pastSAR := previousLow
            pastExtremum := high
        else
            isUptrend := false
            Extremum := low
            pastSAR := previousHigh
            pastExtremum := low
        isNewTrendBar := true
        SARValue := pastSAR + initial * (pastExtremum - pastSAR)
    if isUptrend
        if SARValue > low
            isNewTrendBar := true
            isUptrend := false
            SARValue := math.max(Extremum, high)
            Extremum := low
            Accelerator := initial
    else
        if SARValue < high
            isNewTrendBar := true
            isUptrend := true
            SARValue := math.min(Extremum, low)
            Extremum := high
            Accelerator := initial
    if not isNewTrendBar
        if isUptrend
            if high > Extremum
                Extremum := high
                Accelerator := math.min(Accelerator + step, cap)
        else
            if low < Extremum
                Extremum := low
                Accelerator := math.min(Accelerator + step, cap)
    if isUptrend
        SARValue := math.min(SARValue, low[1])
        if bar_index > 1
            SARValue := math.min(SARValue, low[2])
    else
        SARValue := math.max(SARValue, high[1])
        if bar_index > 1
            SARValue := math.max(SARValue, high[2])
    futureSAR := SARValue + Accelerator * (Extremum - SARValue)
    if barstate.isconfirmed
        if isUptrend
            strategy.entry("ShortEntry", strategy.short, stop=futureSAR, comment="ShortEntry")
            strategy.cancel("LongEntry")
        else
            strategy.entry("LongEntry", strategy.long, stop=futureSAR, comment="LongEntry")
            strategy.cancel("ShortEntry")
plot(SARValue, style=plot.style_cross, linewidth=3, color=color.white)
plot(futureSAR, style=plot.style_cross, linewidth=3, color=color.red)