概述
黄金抛物线突破策略是一种技术分析策略,它结合了黄金抛物线形态判断和均线突破 Exit 信号,目标是在黄金抛物线形成时进入场内,并在突破 Exit 信号时退出,实现交易盈利。
策略原理
该策略主要基于以下几点判断规则:
使用 5 根 K 线的最高价和最低价的简单移动平均线绘制黄金抛物线通道。
当收盘价从下向上突破通道时,形成黄金抛物线形态,作为买入信号进入场内。此时说明价格正在突破通道上沿,可能进入行情。
买入后,Trail 追踪止损在入场价附近,防止止损。同时设置移动止盈线以锁定利润。
当价格突破通道下沿时产生 Exit 信号,关闭买入订单,退出场内。此时说明价格可能重新进入震荡或下行通道。
该策略主要判断标准包括黄金抛物线形态判断和均线突破 Exit 信号判断,使其在趋势突破时进入,并可通过移动止盈止损来控制风险。
策略优势
该策略具有以下几点优势:
结合了形态分析和技术指标判断,提高了交易信号的可靠性。
通过移动止损来控制单笔损失风险,避免亏损过大。
利用移动止盈来锁定利润,防止利润回吐。
具有较高的盈亏比,适合追求稳定收益的投资者。
easytrade 策略语法简单,易于编写和优化。
策略风险
该策略也存在以下风险:
价格可能不会有效突破通道,导致形成假突破。这会造成不必要的亏损。可以通过优化参数降低假突破概率。
移动止损可能被突破,从而扩大亏损。这需要合理设置止损距离。
移动止盈可能过早退出,失去更大利润机会。这需要根据市场调整止盈位置。
需适时调整通道参数,以适应不同周期的行情调整。
策略优化方向
该策略可以从以下几个方面进行优化:
优化通道参数,找到更加合适的参数组合,提高信号质量。
增加其他过滤条件,如交易量突增等,提高信号的准确率。
尝试其他 Exit 信号,如布林线 Exit 或 SAR Stop 等,寻找更佳的 Exit点。
测试不同的止损、止盈算法,优化资金管理。
增加适应性模块,使策略参数能根据实时行情进行自动优化。
总结
黄金抛物线突破策略结合形态分析和技术指标判断,具有交易信号质量较高、止损止盈控制风险的优点。该策略可以通过多种方式进行优化提高盈利能力,是一种易于掌握且收益稳定的量化交易策略。它适合有一定基础但希望获得稳定收益的投资者。
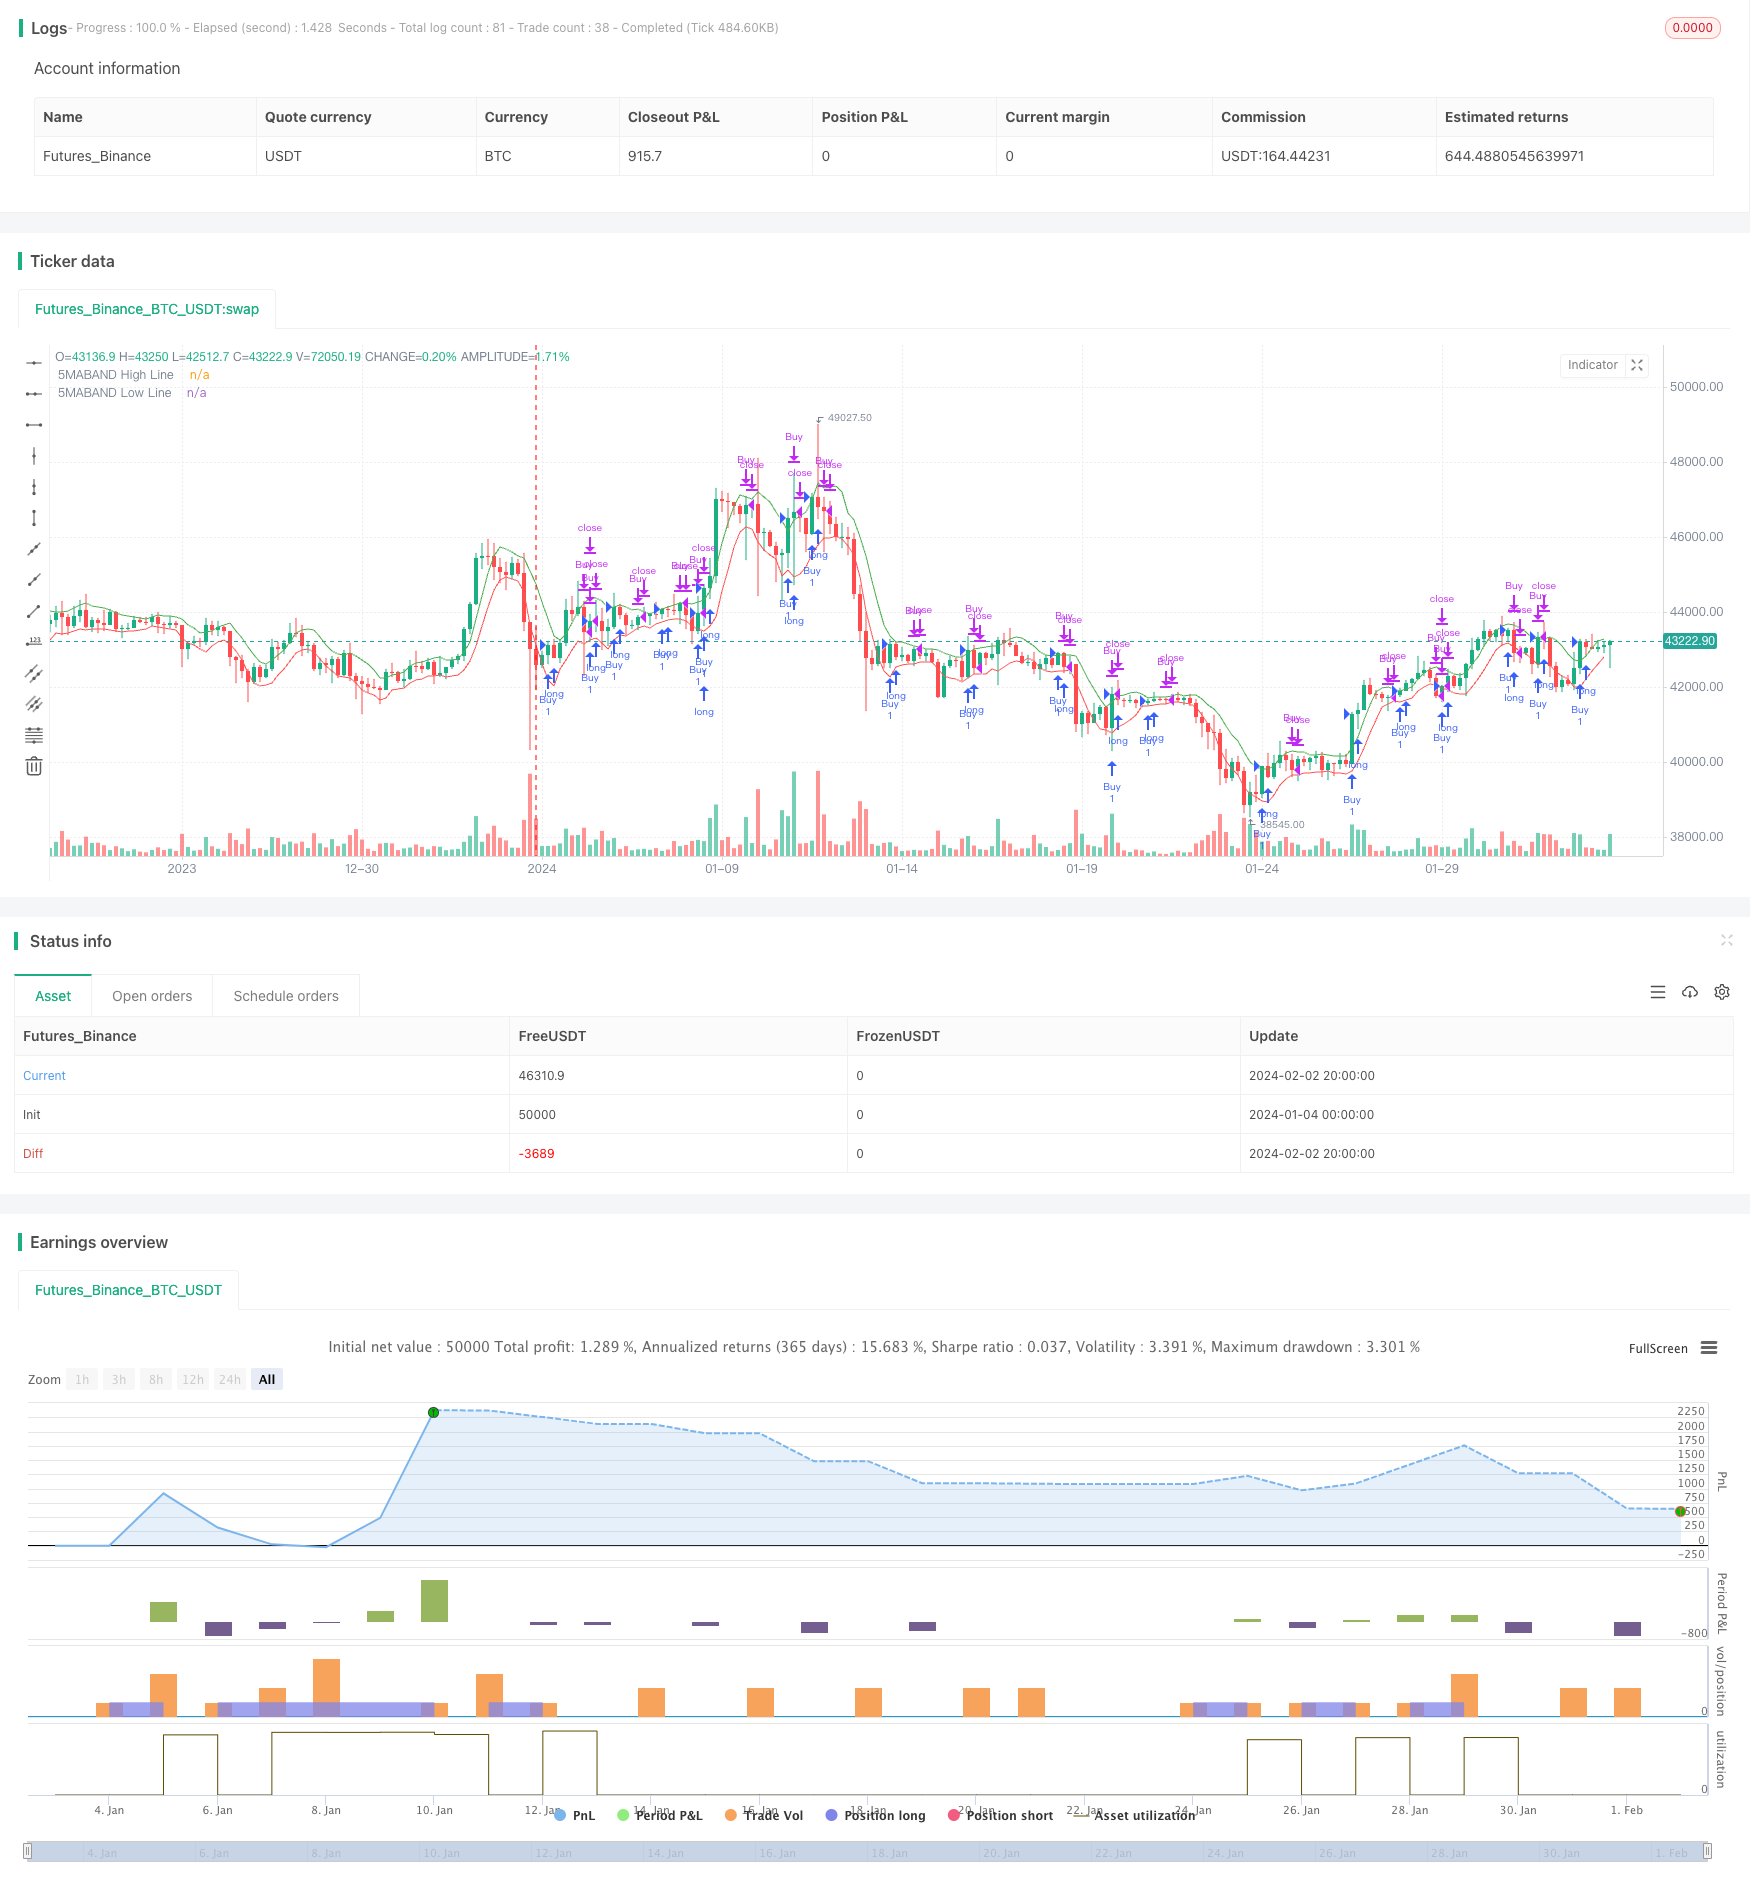
/*backtest
start: 2024-01-04 00:00:00
end: 2024-02-03 00:00:00
period: 4h
basePeriod: 15m
exchanges: [{"eid":"Futures_Binance","currency":"BTC_USDT"}]
*/

//@version=5
strategy("5MABAND + GBS Buy & Sell Strategy", overlay=true)

// Command 1 - 5MABAND Calculation
length = input(5, title="Number of Candles for Average")
avgHigh = ta.sma(high, length)
avgLow = ta.sma(low, length)

// Plotting 5MABAND Bands
plot(avgHigh, color=color.green, title="5MABAND High Line", linewidth=1)
plot(avgLow, color=color.red, title="5MABAND Low Line", linewidth=1)

// Command 2 - GBS concept Buy Entry
gbsBuyCondition = close > open and high - close < close - open and open - low < close - open and close - open > close[1] - open[1] and close - open > close[2] - open[2] and close - open > close[3] - open[3] and close[1] < avgHigh and close[2] < avgHigh and close[3] < avgHigh and open[1] < avgHigh and open[2] < avgHigh and open[3] < avgHigh

// Command 3 - GBS Concept Sell Entry
gbsSellCondition = open - close > open[1] - close[1] and open - close > open[2] - close[2] and open - close > open[3] - close[3] and open[1] > avgLow and open[2] > avgLow and open[3] > avgLow and open - close > open - low and open - close > high - open

// Command 6 - 5MABAND Exit Trigger
exitTriggerCandle_5MABAND_Buy = low < avgLow
exitTriggerCandle_5MABAND_Sell = high > avgHigh

// Exit Signals for 5MABAND
exitBuySignal_5MABAND = close < avgLow
exitSellSignal_5MABAND = close > avgHigh

// Execute Buy and Sell Orders
strategy.entry("Buy", strategy.long, when = gbsBuyCondition)
strategy.close("Buy", when = exitBuySignal_5MABAND)

strategy.entry("Sell", strategy.short, when = gbsSellCondition)
strategy.close("Sell", when = exitSellSignal_5MABAND)

// Exit Buy and Sell Orders for 5MABAND
strategy.close("Buy", when = exitTriggerCandle_5MABAND_Buy)
strategy.close("Sell", when = exitTriggerCandle_5MABAND_Sell)