概述
动态移平均交叉组合策略(Dynamic Moving Average Crossover Combo Strategy)是一个集成了多个技术指标和市场阶段检测的复合交易策略。它动态计算市场的波动性,根据价格与长期移动平均线的距离和波动性判断市场的三个阶段:震荡、趋势和整理。在不同市场阶段,策略采用不同的入市出场规则,同时结合EMA/SMA交叉、MACD和Bollinger Bands等多个指标发出买入和卖出信号。
策略原理
计算市场波动性
使用ATR(平均真实波动幅度)指标计算最近14天的市场日内波动性。然后用100日简单移动平均线滤波,得到平均波动性。
判断市场阶段
计算价格相对200日简单移动平均线的距离。如果距离超过平均波动性的1.5倍,且方向明确,则判断为趋势行情。如果当前波动性超过平均波动性的1.5倍,则判断为震荡行情。
EMA/SMA交叉
快速EMA周期为10天,慢速SMA周期为30天。当快速EMA上穿慢速SMA时,产生买入信号。
MACD
计算12、26、9参数MACD。当MACD柱变为正值时产生买入信号。
Bollinger Bands
计算20日内的标准差Channel。如果Channel宽度小于自身的20日SMA,则判断为整理期。
入场规则
震荡期:快慢线交叉或MACD柱变正,且收盘价在Bollinger Bands内,则入场做多。
趋势期:快慢线交叉或MACD柱变正则入场做多。
整理期:快慢线交叉,且收盘价高于Lower Band则入场做多。
出场规则
满足以下条件则出场平仓:MACD连续两根K线为负,且收盘价连续两日下跌。
震荡期:另外当StockRSI进入超买区则出场。
整理期:另外当价格低于Upper Band则出场。
优势分析
这是一个结合市场环境判断的智能交易策略,具有以下优势:
系统化操作,减少主观干预。
结合市场环境调整策略参数,更具适应性。
多指标组合,增加信号确定性。
Bollinger Bands自动止损,降低风险。
全方位条件判断,过滤假信号。
动态止损止盈,追踪趋势获利。
风险分析
主要风险如下:
参数设置不当可能导致策略失效。建议优化参数组合。
突发事件造成模型失效。建议及时更新策略逻辑。
交易费用压缩获利空间。建议选择低手续费券商。
多指标组合提高策略复杂度。建议选择核心指标。
优化方向
可以从以下几个维度继续优化:
优化市场环境判断标准,提高准确率。
增加机器学习模块,实现参数自适应。
结合文本处理判断重大事件风险。
多市场回测,寻找最佳组合参数。
增加止盈的 trailing stop 策略。
总结
动态移平均交叉组合策略是一个多指标智能交易策略。它能够结合市场环境调整参数,实现条件判断式的系统化交易。具有较强的适应性和确定性。但参数设置和新增模块都需要谨慎,避免增加策略复杂性。整体而言,这是一个可行性较强的量化策略思路。
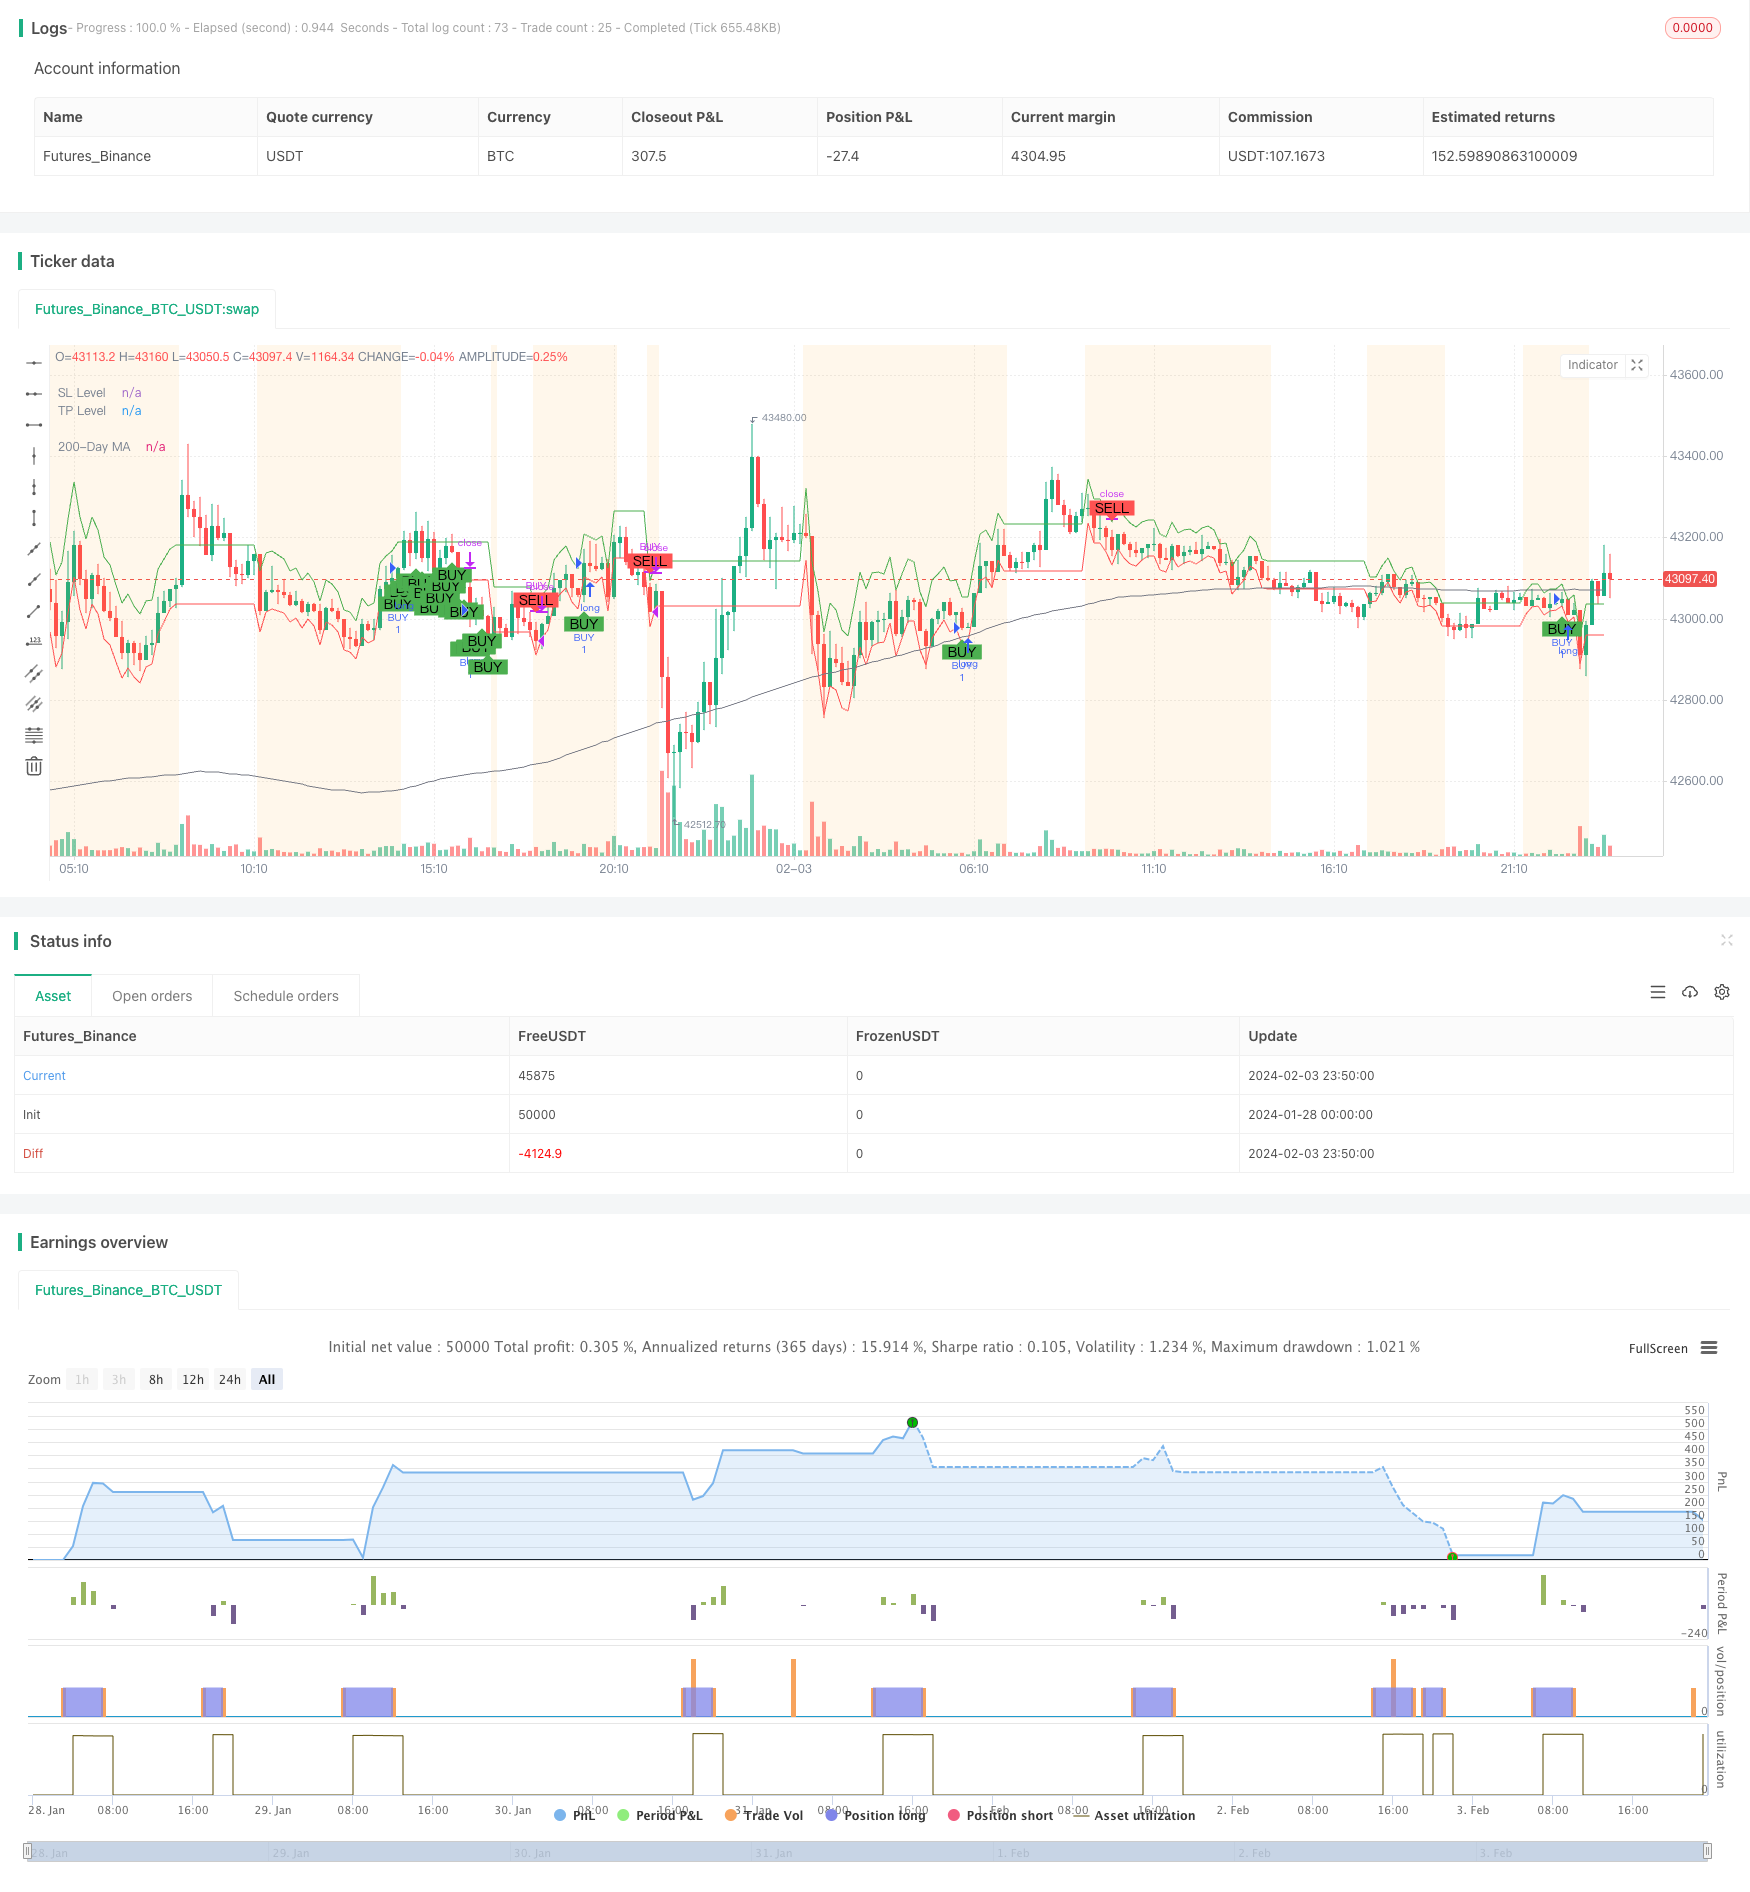
/*backtest
start: 2024-01-28 00:00:00
end: 2024-02-04 00:00:00
period: 10m
basePeriod: 1m
exchanges: [{"eid":"Futures_Binance","currency":"BTC_USDT"}]
*/

//@version=5
strategy("Improved Custom Strategy", shorttitle="ICS", overlay=true)

// Volatility
volatility = ta.atr(14)
avg_volatility_sma = ta.sma(volatility, 100)
avg_volatility = na(avg_volatility_sma) ? 0 : avg_volatility_sma

// Market Phase detection
long_term_ma = ta.sma(close, 200)
distance_from_long_term_ma = close - long_term_ma
var bool isTrending = math.abs(distance_from_long_term_ma) > 1.5 * avg_volatility and not na(distance_from_long_term_ma)
var bool isVolatile = volatility > 1.5 * avg_volatility

// EMA/MA Crossover
fast_length = 10
slow_length = 30
fast_ma = ta.ema(close, fast_length)
slow_ma = ta.sma(close, slow_length)
crossover_signal = ta.crossover(fast_ma, slow_ma)

// MACD
[macdLine, signalLine, macdHistogram] = ta.macd(close, 12, 26, 9)
macd_signal = crossover_signal or (macdHistogram > 0)

// Bollinger Bands
source = close
basis = ta.sma(source, 20)
upper = basis + 2 * ta.stdev(source, 20)
lower = basis - 2 * ta.stdev(source, 20)
isConsolidating = (upper - lower) < ta.sma(upper - lower, 20)

// StockRSI
length = 14
K = 100 * (close - ta.lowest(close, length)) / (ta.highest(close, length) - ta.lowest(close, length))
D = ta.sma(K, 3)
overbought = 75
oversold = 25

var float potential_SL = na
var float potential_TP = na
var bool buy_condition = na
var bool sell_condition = na

// Buy and Sell Control Variables
var bool hasBought = false
var bool hasSold = true

// Previous values tracking
prev_macdHistogram = macdHistogram[1]
prev_close = close[1]

// Modify sell_condition with the new criteria
if isVolatile
    buy_condition := not hasBought and crossover_signal or macd_signal and (close > lower) and (close < upper)
    sell_condition := hasBought and (macdHistogram < 0 and prev_macdHistogram < 0) and (close < prev_close and prev_close < close[2])
    potential_SL := close - 0.5 * volatility
    potential_TP := close + volatility

if isTrending
    buy_condition := not hasBought and crossover_signal or macd_signal
    sell_condition := hasBought and (macdHistogram < 0 and prev_macdHistogram < 0) and (close < prev_close and prev_close < close[2])
    potential_SL := close - volatility
    potential_TP := close + 2 * volatility

if isConsolidating
    buy_condition := not hasBought and crossover_signal and (close > lower)
    sell_condition := hasBought and (close < upper) and (macdHistogram < 0 and prev_macdHistogram < 0) and (close < prev_close and prev_close < close[2])
    potential_SL := close - 0.5 * volatility
    potential_TP := close + volatility

// Update the hasBought and hasSold flags
if buy_condition
    hasBought := true
    hasSold := false

if sell_condition
    hasBought := false
    hasSold := true

// Strategy Entry and Exit
if buy_condition
    strategy.entry("BUY", strategy.long, stop=potential_SL, limit=potential_TP)
    strategy.exit("SELL_TS", from_entry="BUY", trail_price=close, trail_offset=close * 0.05)

if sell_condition
    strategy.close("BUY")

// Visualization
plotshape(series=buy_condition, style=shape.labelup, location=location.belowbar, color=color.green, text="BUY", size=size.small)
plotshape(series=sell_condition, style=shape.labeldown, location=location.abovebar, color=color.red, text="SELL", size=size.small)

plot(long_term_ma, color=color.gray, title="200-Day MA", linewidth=1)
plot(potential_SL, title="SL Level", color=color.red, linewidth=1, style=plot.style_linebr)
plot(potential_TP, title="TP Level", color=color.green, linewidth=1, style=plot.style_linebr)

bgcolor(isVolatile ? color.new(color.purple, 90) : isTrending ? color.new(color.blue, 90) : isConsolidating ? color.new(color.orange, 90) : na)