Closing Price Comparison Dual Moving Average Crossover Strategy

Author: ChaoZhang, Date: 2024-02-05 10:34:57
Tags:

img

Overview

The Closing Price Comparison Dual Moving Average Crossover strategy is a relatively simple quantitative trading strategy. It calculates the recent 7 candle’s average closing price and 20 candle’s average closing price. When the short-term moving average crosses over the long-term moving average from below, it signals a long position. When the short-term moving average crosses below the long-term moving average, it signals a short position. This allows the strategy to capture the inflection points in market’s mid-term trends.

Strategy Logic

The core logic of this strategy is to calculate the average closing price of recent 7 candles (excluding the current candle) as the short-term moving average, and the average closing price of 20 candles (excluding recent 7 candles) as the long-term moving average. When the short-term moving average crosses over the long-term moving average from below, it indicates the market is turning from decline to rise, signaling a long position. When the short-term moving average crosses below the long-term moving average from above, it indicates the market is turning from rise to decline, signaling a short position.

Upon long signal, long position will be opened using the whole account capital. Upon short signal, the existing long position will be closed first before opening the short position using the same amount. Each opened position will be hold for 20-25 candles. During this period, if loss occurs, 50% of the position will be stopped loss. If sufficient profit occurs, 50% of the position will be taken profit.

Advantage Analysis

The advantages of this simple dual moving average crossover strategy are:

  1. Simple logic, easy to understand and implement;
  2. Using crossing of different period moving averages to determine inflection points in mid-term market trends, which is a widely used technical indicator;
  3. Can filter out market noise effectively and capture mid-term trends;
  4. Suitable for mid-long term trading, with 20-25 candle hold per position and good profit/loss ratio;
  5. Built-in stop loss and take profit mechanisms to control risks and lock in profits.

Risk Analysis

As a simple trend following strategy, it also faces some potential risks:

  1. Increased whipsaws and false signals when market enters consolidation;
  2. Price spikes during hold period may trigger stop loss;
  3. Hard to effectively determine true market reversal points, trading signal may lag.

The optimizations to address these risks are:

  1. Add filters, check if price breaks key support/resistance levels when MAs cross to remove false signals;
  2. Adjust hold period, shorten average hold time per position to control loss;
  3. Add other technical indicators to determine true market reversal points.

Optimization Directions

As a simple dual moving average crossover strategy, the main optimizations are:

  1. Optimize MA parameters, test different short and long term MA combinations for best parameters;

  2. Add other filter indicators like volume, volatility index etc. to avoid wrong signals in choppy markets;

  3. Optimize stop loss and take profit strategies, test different ratios to find optimum;

  4. Test effectiveness across different market cycles and optimize hold period;

  5. Add machine learning algorithms, keep optimizing parameters through back-testing for more robustness.

Conclusion

In summary, this is a simple dual moving average crossover strategy, using MA crossovers across different periods to determine mid-term trend inflection points. It has high practicality and is easy to operate. But it also has limitations in effectively determining true market reversal points. Further optimizations on adding filters, parameter tuning, machine learning etc. are needed to make it more robust across varying market conditions for consistent alpha.


/*backtest
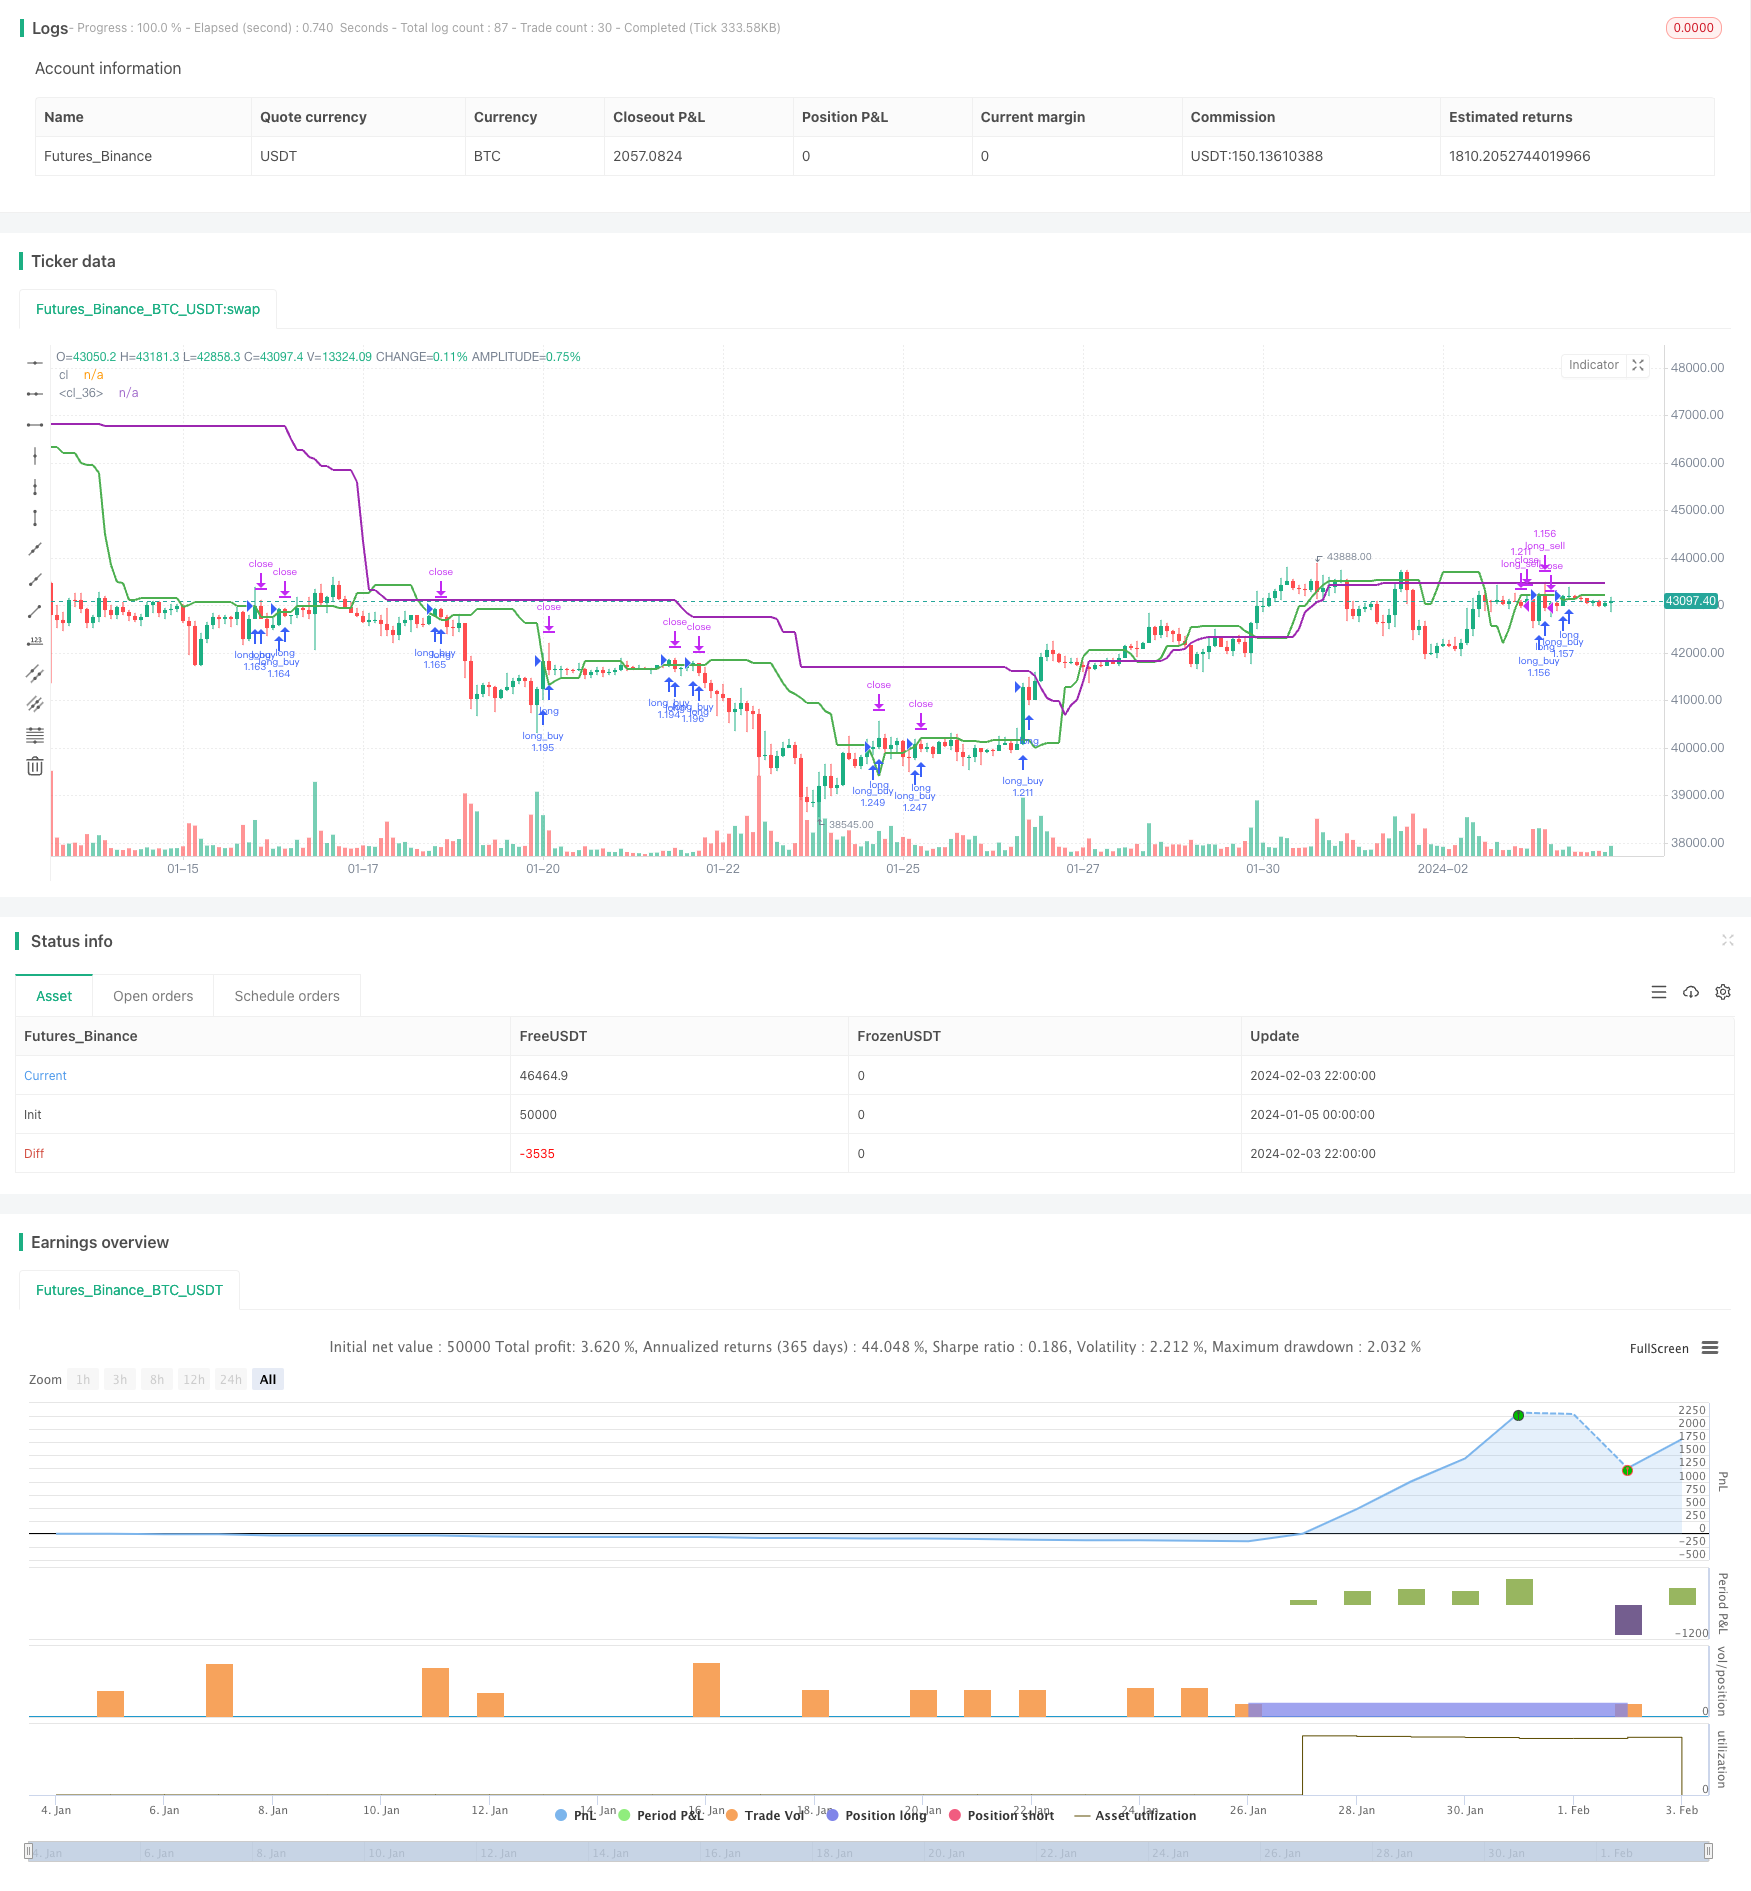
start: 2024-01-05 00:00:00
end: 2024-02-04 00:00:00
period: 2h
basePeriod: 15m
exchanges: [{"eid":"Futures_Binance","currency":"BTC_USDT"}]
*/

// This source code is subject to the terms of the Mozilla Public License 2.0 at https://mozilla.org/MPL/2.0/
// © nrathi2211

//@version=5
strategy("Closing Prices", overlay=true)

//variables
closingB7 = ta.highest(close, 7)[7]
closingB14 = ta.highest(close, 7)[20]
highB14 = ta.highest(low, 50)[7]
capital = 50000

//functions
qty_find(float price) => capital / int(price)

profit_take() =>
    profit = strategy.opentrades.profit(strategy.opentrades - 1)
    profit*.95 

if(closingB7 < closingB14)
    if(ta.crossover(close, closingB7))
        strategy.entry("long_buy", strategy.long, qty_find(close))

    current_profit = strategy.opentrades.profit(strategy.opentrades - 1)
    if(current_profit < 0)
        strategy.close("Exit long_buy SL", "long_buy", qty_percent = 50)
    
    else if(current_profit < profit_take())
        strategy.close("Exit long_buy TP", "long_buy", qty_percent = 50)
    
    if(ta.crossunder(close, closingB7))
        strategy.exit("long_sell", from_entry = "long_buy", stop = closingB7)

plot(closingB7, "cl", color.green, 2)
//plot(closingB14, "cl", color.red, 2)
plot(highB14, "cl", color.purple, 2)


More