概述
本策略基于Parabolic SAR指标实现了一个简单高效的股票波动跟踪和自动止盈止损的策略。它可以动态跟踪股票价格的涨跌趋势,并在涨跌反转点自动设置止盈止损点,无需人工干预,实现自动化交易。
策略原理
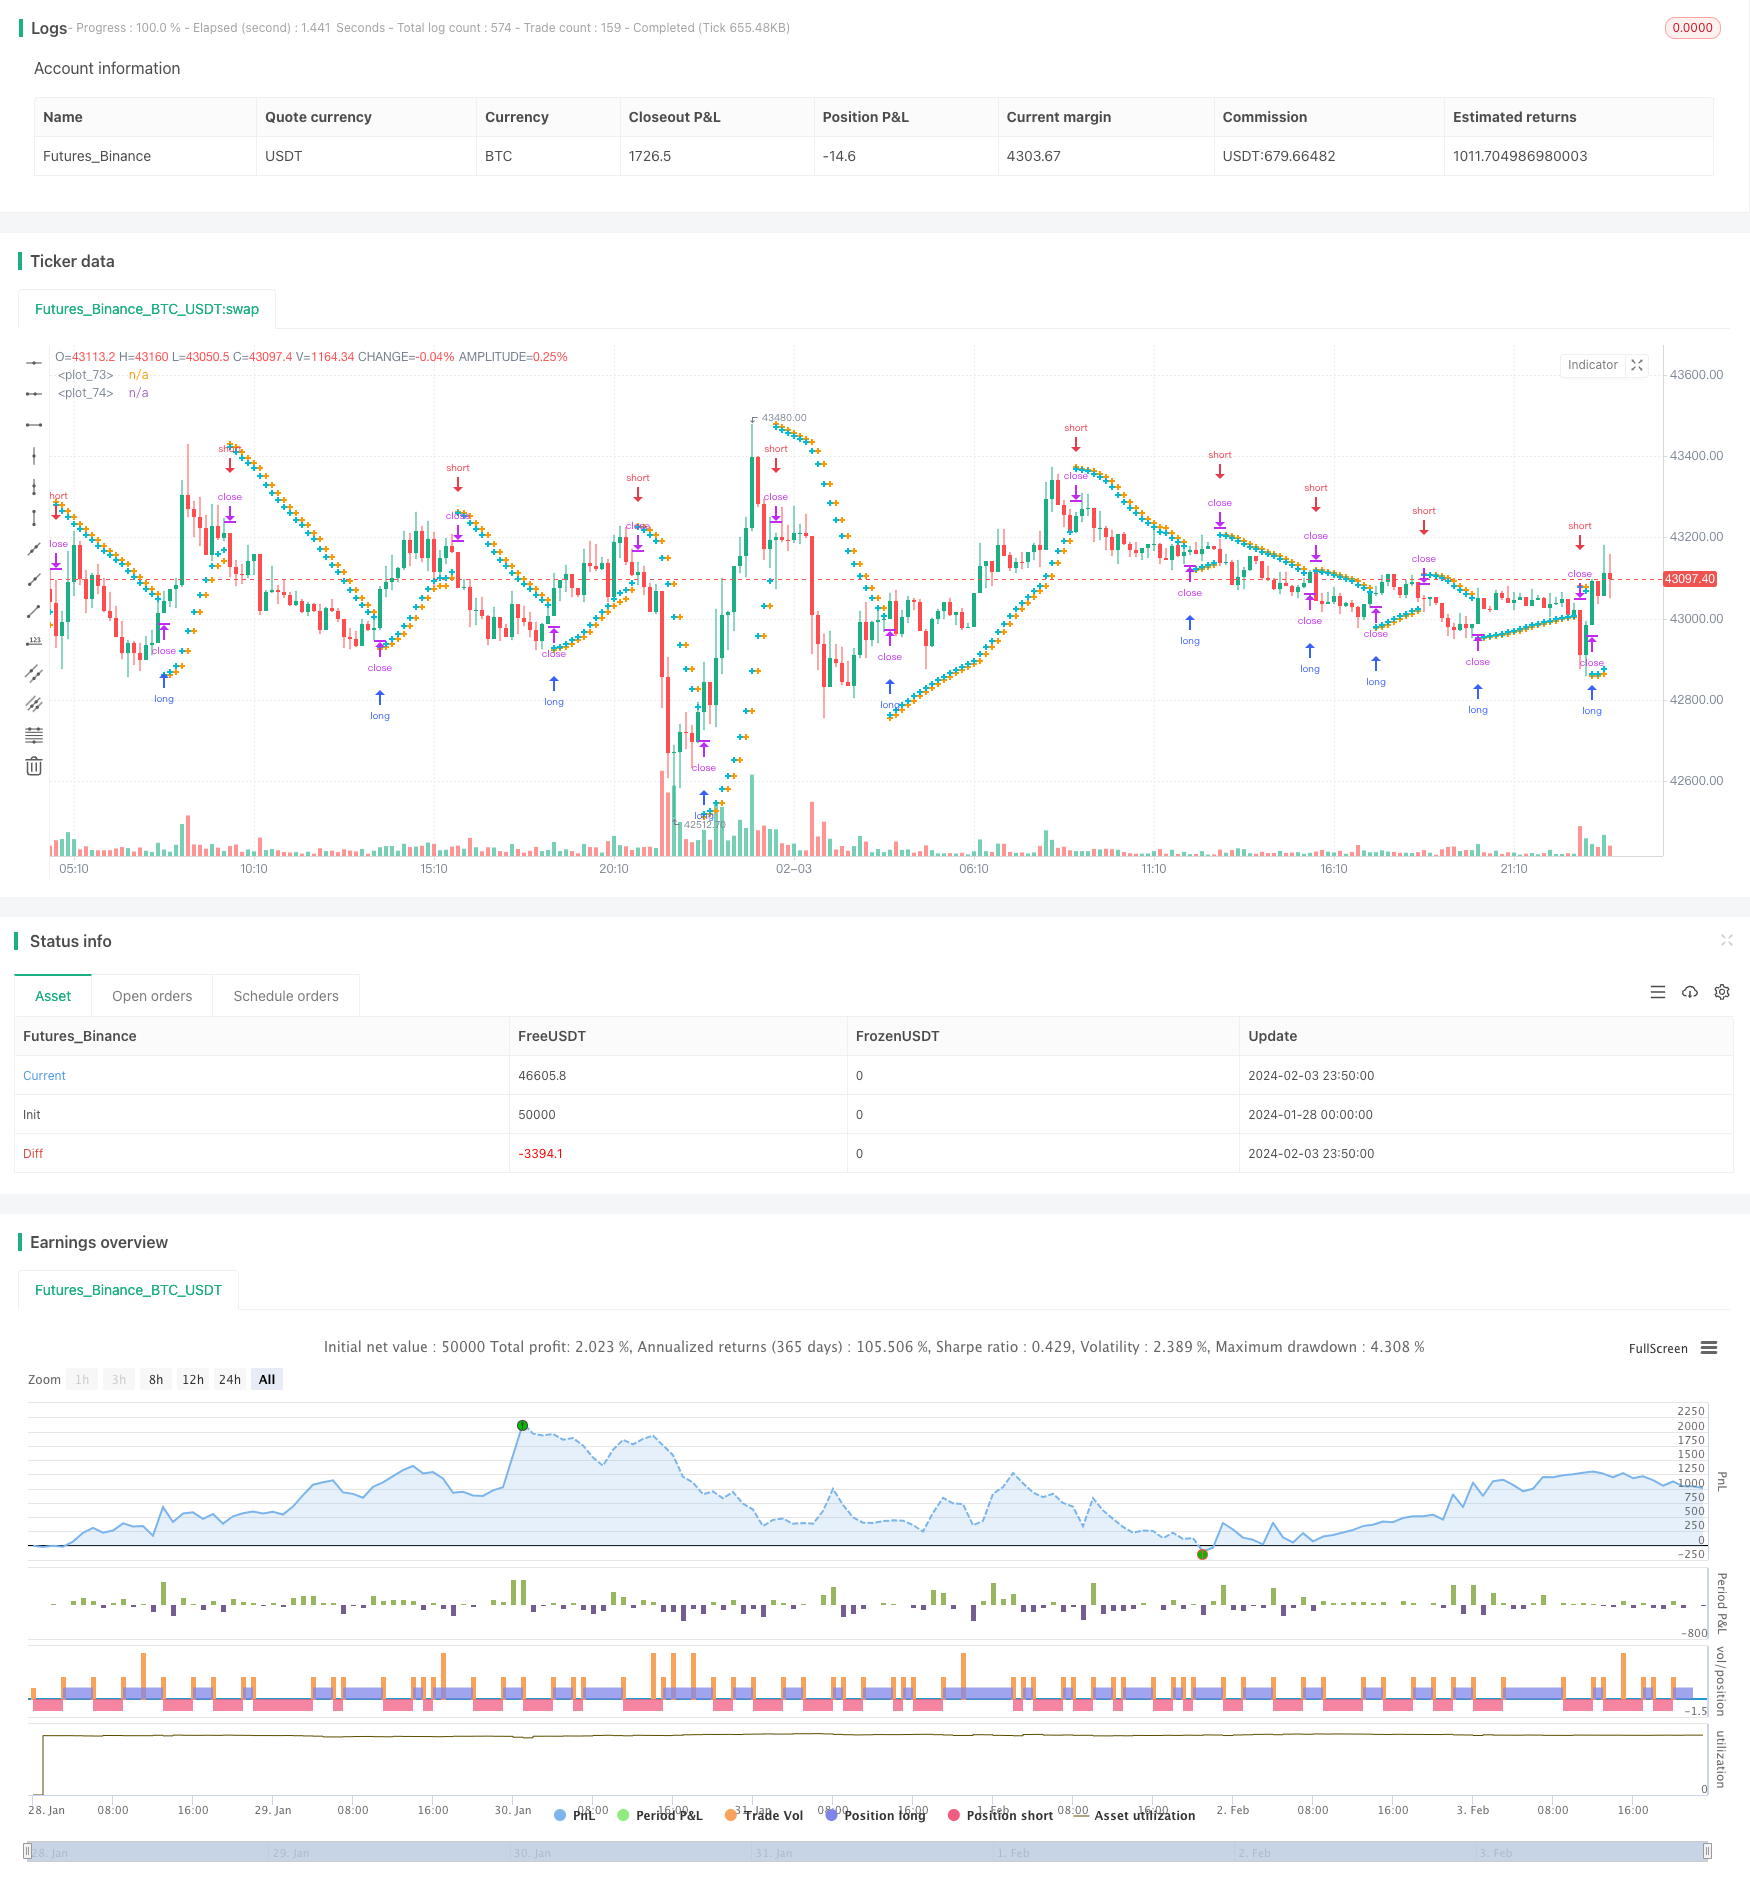
本策略使用Parabolic SAR指标判断股票价格波动的趋势方向。当PSAR指标位于K线之下时,表示正在上涨趋势;当PSAR指标位于K线之上时,表示正在下跌趋势。策略会实时追踪PSAR值的变化来判断趋势的变化。
在确认上的涨趋势时,策略会在下一个BAR的PSAR点位设置止损点;在确认下跌趋势时,策略会在下一个BAR的PSAR点位设置止盈点。这样就实现了股票价格反转时,自动止盈止损的功能。
同时,策略内置了起步值、步进值和最大值等参数,可以调整PSAR指标的敏感度,从而优化止盈止损的效果。
策略优势分析
本策略最大的优势在于实现了股票波动跟踪和自动止盈止损的全自动化。不需要人工判断市场走势就可以实现盈利,大大降低了手工交易的时间和精力成本。
相比传统止损止盈策略,本策略的止盈止损点是浮动变化的,能更快捷地捕捉价格变化带来的机会,同时也能降低错误判断的概率,提高盈利空间。
在参数优化后,本策略可以在大趋势中持续盈利,同时在反转来临时自动止损Protect本金。
风险分析
本策略最大的风险在于PSAR指标判断错趋势方向的概率。当股票价格出现短期调整震荡时,PSAR指标可能发生错误信号。此时就需要合理优化PSAR的参数,提高判断准确性。
另一个风险点是止盈止损点过于接近当前价格。这可能导致止损点被突破的概率增加,给本金带来更大冲击。此时需要适当放宽止盈止损范围,保证有足够的缓冲空间。
策略优化方向
本策略的优化余地主要集中在PSAR指标本身的参数调整上。通过测试不同股票并优化起步值、步进值和最大值的设置,可以使PSAR指标对价格波动更加敏感,同时也要保证判断准确性。这需要大量的回测和分析工作。
另一个优化方向是设置止盈止损的范围。这需要研究不同股票的日内波动范围,并在此基础上设定合理的盈亏比例要求。这可以进一步减少本金损失的概率。
总结
本策略利用Parabolic SAR指标实现了股票跟踪和自动止盈止损的全自动化交易策略。它最大的优势是无需人工干预,可以降低时间和精力成本。风险主要来自指标判断失误,可以通过参数优化来减少。总体而言,本策略为股票量化交易提供了一个高效可靠的解决方案。
/*backtest
start: 2024-01-28 00:00:00
end: 2024-02-04 00:00:00
period: 10m
basePeriod: 1m
exchanges: [{"eid":"Futures_Binance","currency":"BTC_USDT"}]
*/

//@version=4
strategy("Swing Parabolic SAR Strategy", overlay=true)
start = input(0.02)
increment = input(0.02)
maximum = input(0.2)
var bool uptrend = na
var float EP = na
var float SAR = na
var float AF = start
var float nextBarSAR = na
if bar_index > 0
	firstTrendBar = false
	SAR := nextBarSAR
	if bar_index == 1
		float prevSAR = na
		float prevEP = na
		lowPrev = low[1]
		highPrev = high[1]
		closeCur = close
		closePrev = close[1]
		if closeCur > closePrev
			uptrend := true
			EP := high
			prevSAR := lowPrev
			prevEP := high
		else
			uptrend := false
			EP := low
			prevSAR := highPrev
			prevEP := low
		firstTrendBar := true
		SAR := prevSAR + start * (prevEP - prevSAR)
	if uptrend
		if SAR > low
			firstTrendBar := true
			uptrend := false
			SAR := max(EP, high)
			EP := low
			AF := start
	else
		if SAR < high
			firstTrendBar := true
			uptrend := true
			SAR := min(EP, low)
			EP := high
			AF := start
	if not firstTrendBar
		if uptrend
			if high > EP
				EP := high
				AF := min(AF + increment, maximum)
		else
			if low < EP
				EP := low
				AF := min(AF + increment, maximum)
	if uptrend
		SAR := min(SAR, low[1])
		if bar_index > 1
			SAR := min(SAR, low[2])
	else
		SAR := max(SAR, high[1])
		if bar_index > 1
			SAR := max(SAR, high[2])
	nextBarSAR := SAR + AF * (EP - SAR)
	if barstate.isconfirmed
		if uptrend
			strategy.entry("short", strategy.short, stop=nextBarSAR, comment="short")
			strategy.cancel("long")
		else
			strategy.entry("long", strategy.long, stop=nextBarSAR, comment="long")
			strategy.cancel("short")

plot(SAR, style=plot.style_cross, linewidth=3, color=color.orange)
plot(nextBarSAR, style=plot.style_cross, linewidth=3, color=color.aqua)