概述
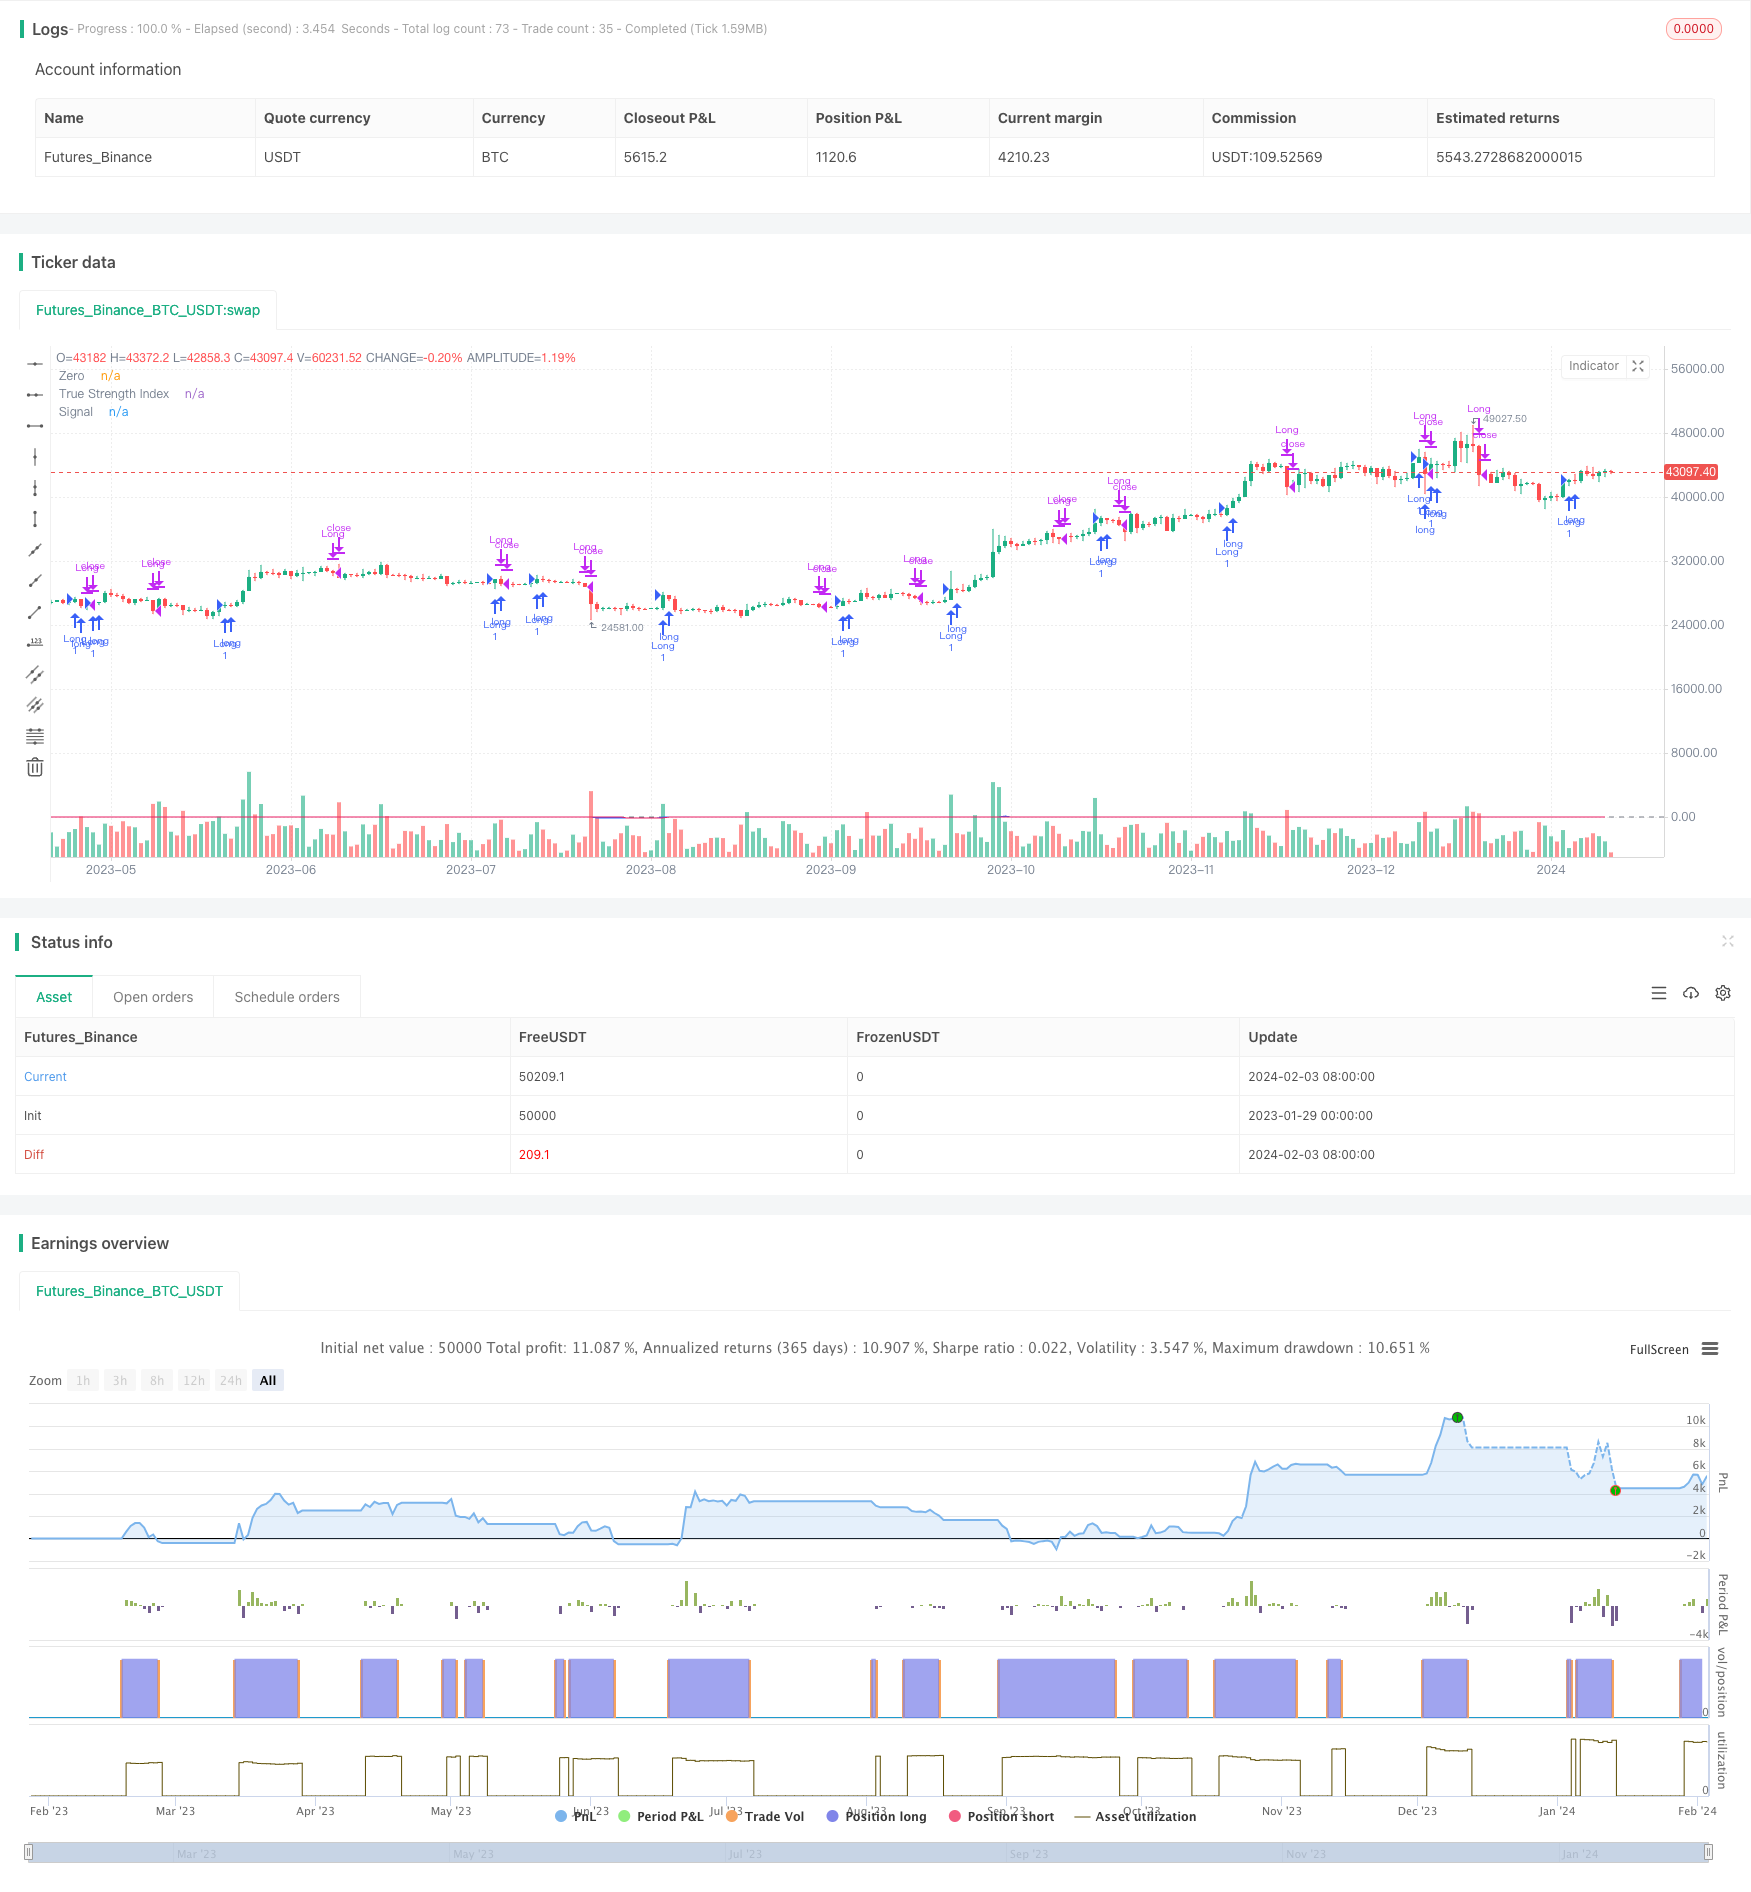
本策略运用双平滑均线振荡器指标来判断股票的买入和卖出点。双平滑均线振荡器指数由长短两个不同参数的双指数移动平均线构成,通过计算价格变动的动量来测量超买超卖现象。
策略原理
本策略的核心指标是双平滑均线振荡器指数(TSI)。该指数的计算方法是:
计算价格的变动pc=close-preclose
对pc进行双指数平滑处理,分别取长周期12日和短周期9日指数平均。得到双平滑price change:double_smoothed_pc
同样对绝对值|pc|进行双指数平滑处理,得到double_smoothed_abs_pc
最终TSI指数=100*(double_smoothed_pc/double_smoothed_abs_pc)
通过计算TSI值与其信号线tsi_signal的关系,判断所处的超买超卖区域,以此决定买入和卖出。
买入信号:TSI值上穿其信号线,表明股价反转,步入超卖区域,可以买入。
卖出信号:TSI值下穿其信号线,表明股价反转,超卖区域结束,应当卖出。
优势分析
本策略最大的优势在于使用双平滑均线指标识别股价中的周期性特征。双平滑均线指标中同时使用长短两个周期,可以更加灵敏和准确地捕捉价格变化趋势,在判断买卖点时相比单一均线具有更强的优势。
另外,本策略选用TSI指数而不是其他常见的技术指标,原因在于TSI指数更加注重计算价格变动的动量信息。这可以更加准确地判断超买超卖现象,从而取得更佳的买卖节点选择。
风险分析
本策略最大的风险在于双平滑均线本身对价格变化的灵敏度较高,当股价出现震荡时,容易产生错误信号。此外,TSI指数判断超买超卖区域的标准依然比较主观,参数设置不当也会影响判断的准确性。
为控制这些风险,建议适当优化参数,调整长短均线的长度;同时结合其他指标来验证信号,避免在震荡行情中打开仓位。此外,优化止损策略,对突发事件设置风控措施也非常必要。
优化方向
本策略的优化方向主要集中在两个方面:
参数优化。可以通过更多的回测来测试长短均线和信号线参数的最优组合,提高指标的灵敏度。
配置过滤指标。例如结合布林带、KDJ等其他指标来验证买卖信号,避免错误开仓。或者设立交易量过滤,只在交易量放大的情况下开仓。
增加止损策略。设立移动止损、时间止损来控制单笔损失。同时,也可以根据大盘情况来暂停交易,控制系统性风险。
优化仓位管理。设立动态调整的仓位规模和比例,能够根据市场情况来控制每笔交易的风险敞口。
总结
本策略利用双平滑均线振荡器指数的计算方法,同时融合长短两个周期分析价格动量变化,从而判断超买超卖区域,决定买入卖出的时机。相比单一均线,具有判断更为准确灵敏的优点。当然,仍需适当优化参数,并辅以其他指标来过滤信号,从而提高策略的稳定性和盈利能力。总的来说,本策略提供了一种有效判断买卖点的技术手段,值得实盘验证与优化。
/*backtest
start: 2023-01-29 00:00:00
end: 2024-02-04 00:00:00
period: 1d
basePeriod: 1h
exchanges: [{"eid":"Futures_Binance","currency":"BTC_USDT"}]
*/

// This Pine Script™ code is subject to the terms of the Mozilla Public License 2.0 at https://mozilla.org/MPL/2.0/
// © shankardey7310

//@version=5
strategy("TSI STOCKS", shorttitle="TSI", overlay=true)

initialCapital = input(10000, title="Initial Capital")
riskPercent = input(1, title="Risk Percentage") / 100

longLength = input(12, title="Long Length")
shortLength = input(9, title="Short Length")
signalLength = input(12, title="Signal Length")

price = close
pc = ta.change(price)

double_smooth(src, long, short) =>
    first_smooth = ta.ema(src, long)
    ta.ema(first_smooth, short)

double_smoothed_pc = double_smooth(pc, longLength, shortLength)
double_smoothed_abs_pc = double_smooth(math.abs(pc), longLength, shortLength)
tsi_value = 100 * (double_smoothed_pc / double_smoothed_abs_pc)
tsi_signal = ta.ema(tsi_value, signalLength)

riskAmount = (initialCapital * riskPercent) / close

if (tsi_value > tsi_signal and tsi_value[1] <= tsi_signal[1])
    strategy.entry("Long", strategy.long)

if (tsi_value < tsi_signal and tsi_value[1] >= tsi_signal[1])
    strategy.close("Long")

plot(tsi_value, title="True Strength Index", color=#2962FF)
plot(tsi_signal, title="Signal", color=#E91E63)
hline(0, title="Zero", color=#787B86)