资源加载中... loading...

Engulfing Candle RSI Trading Strategy

Author: ChaoZhang, Date: 2024-02-05 11:06:58
Tags:

img

Overview

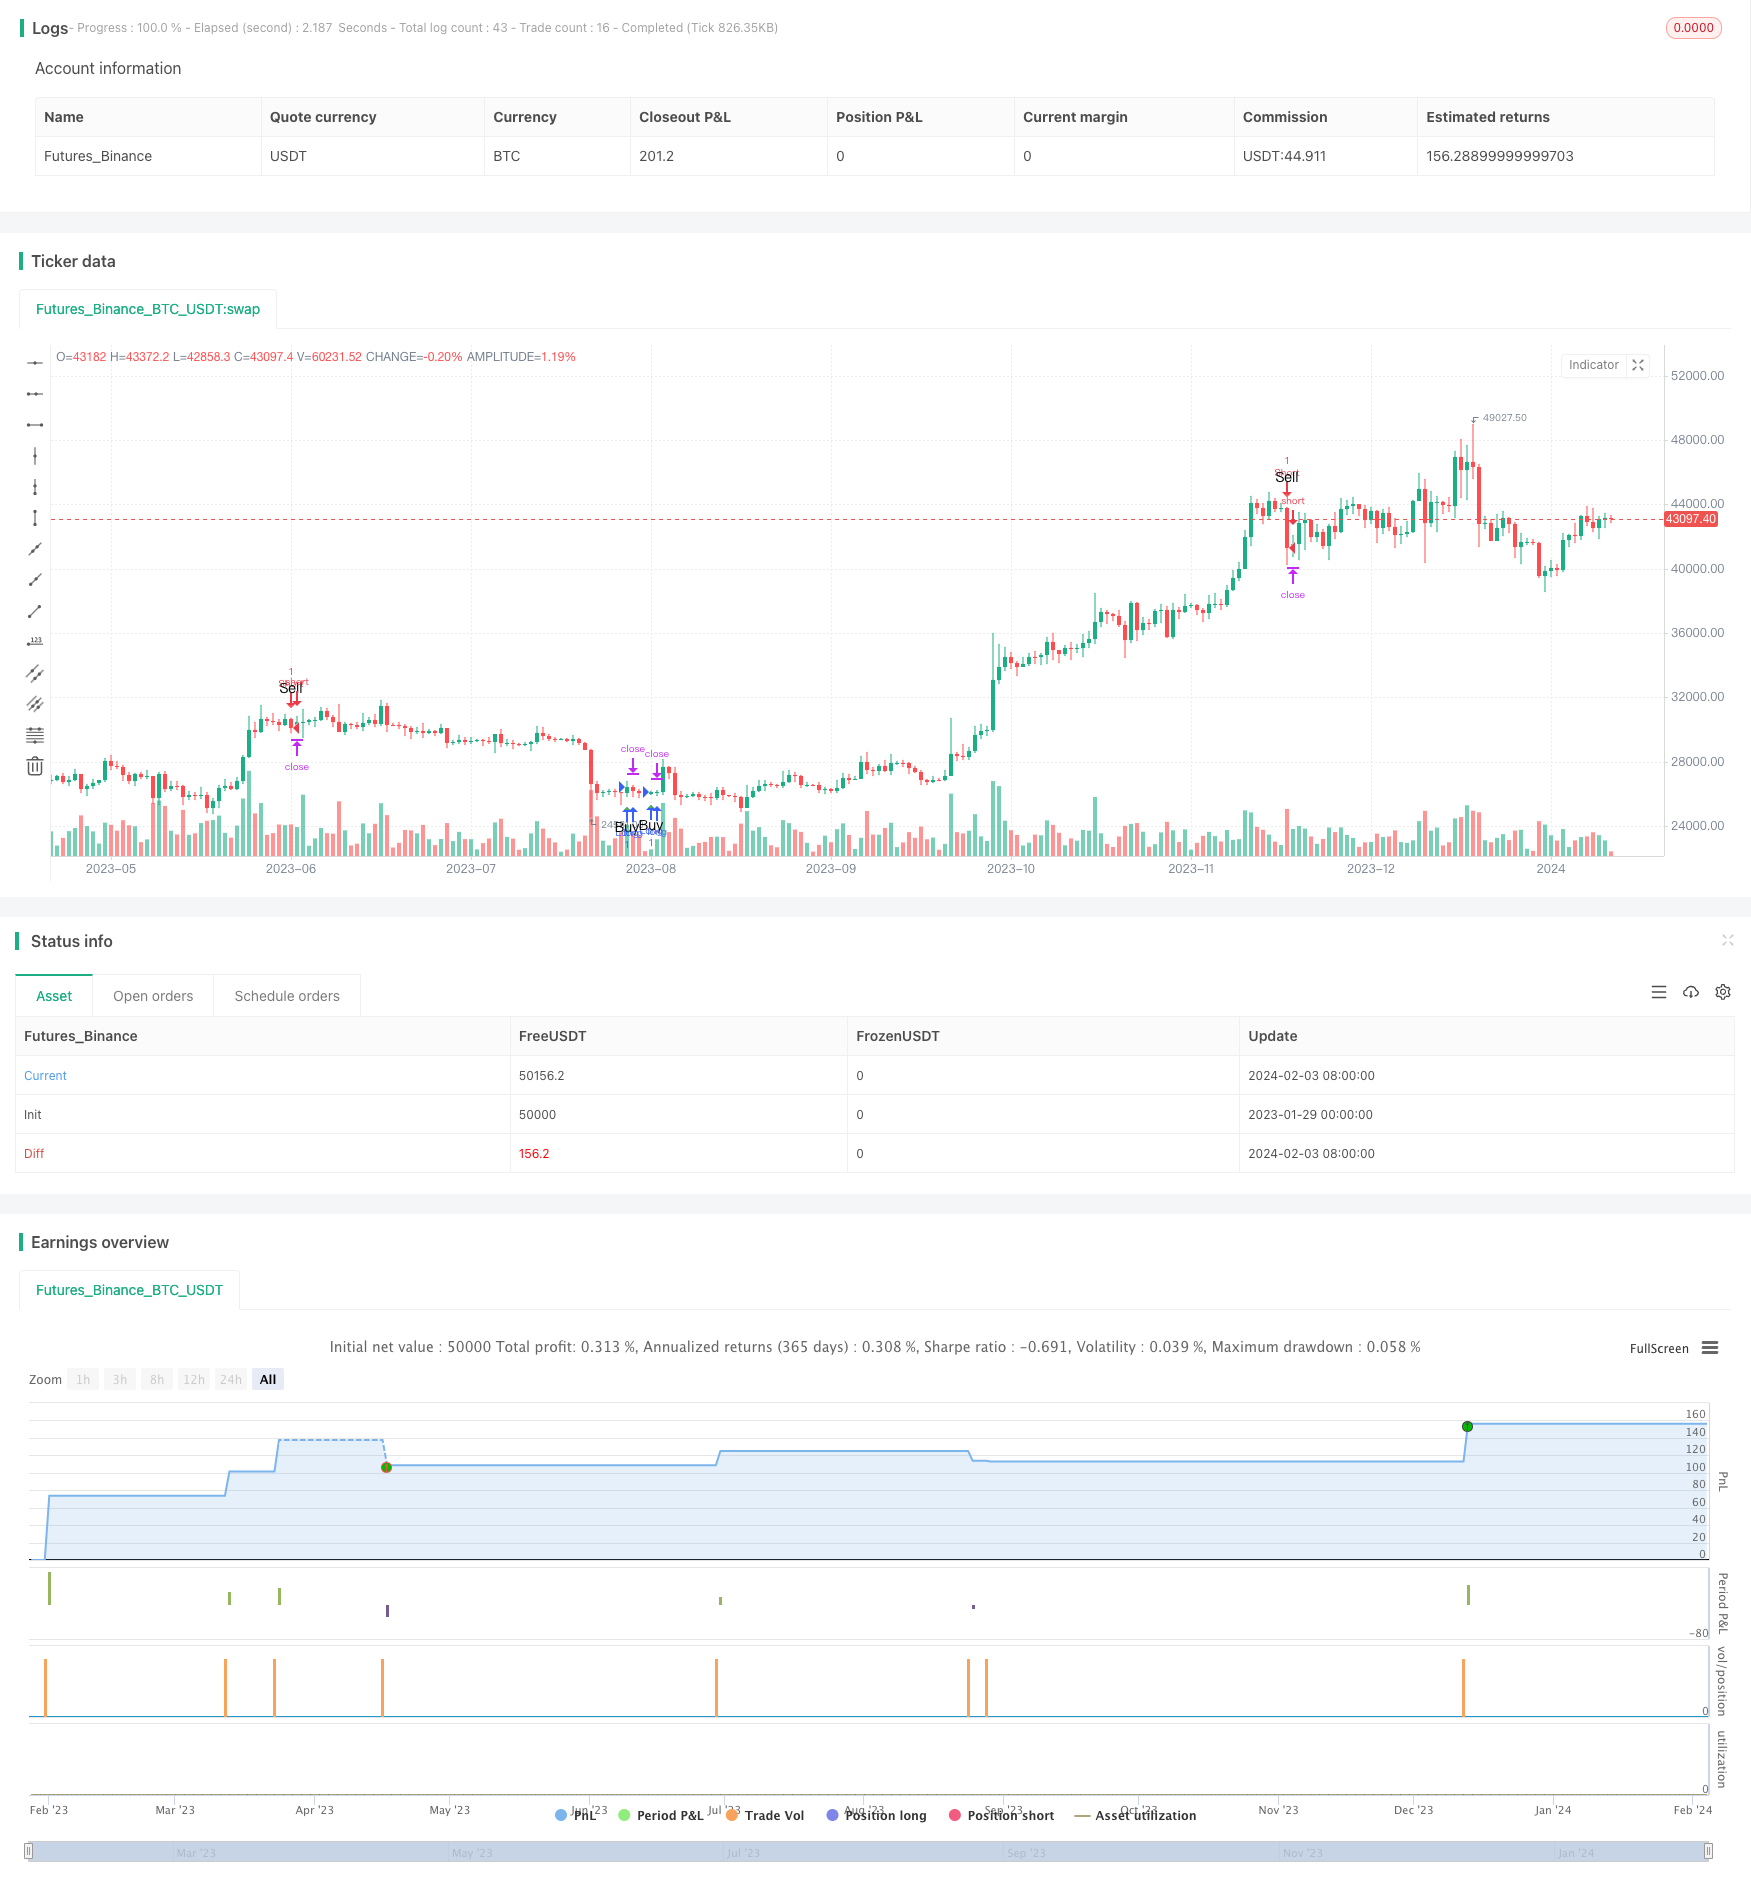
The Engulfing Candle RSI trading strategy is a strategy that tries to generate trading signals by combining candlestick pattern analysis and the Relative Strength Index (RSI) indicator. It detects RSI overbought/oversold levels and bullish/bearish engulfing candlestick patterns to produce trade signals.

Strategy Logic

The core idea of this strategy is to use RSI and candlestick pattern analysis together.

For RSI, the strategy sets two levels - overbought level (default 70) and oversold level (default 30). When RSI is above overbought level, it generates an RSI overbought signal. When RSI is below oversold level, it generates an RSI oversold signal. This indicates potential price reversals.

For candlestick pattern analysis, the strategy detects if bullish or bearish engulfing patterns occur. A bullish engulfing is when today’s close price is above yesterday’s open price, and yesterday’s close price is below yesterday’s open price. A bearish engulfing is the opposite, where today’s close price is below yesterday’s open price, and yesterday’s close price is above yesterday’s open price. These candlestick patterns usually signify turning points in price.

In summary, when a bullish engulfing occurs, if there were also RSI oversold signals before, a buy signal is generated. When a bearish engulfing occurs, if there were also RSI overbought signals before, a sell signal is generated. Through this combination, the strategy tries to catch trends at reversal points.

Advantage Analysis

The main advantages of this strategy are:

  1. Combines RSI indicator and candlestick pattern analysis, utilizing two different types of technical analysis tools to make signals more reliable.

  2. RSI is commonly used to identify price reversals. Combining with candlestick pattern confirmation can determine reversal timing more precisely.

  3. Engulfing candlestick patterns often occur at price reversal points. Using together with RSI can make trade signals more timely.

  4. The strategy has abundant trading opportunities, suitable for frequent trading. Due to its simplicity by only considering RSI and candlestick patterns, trade signals are more frequent.

  5. RSI parameters can be flexibly tuned for different products and market environments, improving the adaptiveness of the strategy.

Risk Analysis

There are also some risks with this strategy:

  1. Both candlestick patterns and RSI may generate false signals, causing unnecessary losses.

  2. The strategy may miss major trend direction if judging RSI and candlestick patterns incorrectly.

  3. Stop loss may be penetrated during high market volatility, causing huge losses.

  4. Too frequent trading may increase transaction and slippage costs.

To control these risks, some optimization can be done:

  1. Fine tune RSI parameters, or add other indicators for filtering to reduce false signals.

  2. Add trend detection indicators to avoid counter trend trading.

  3. Optimize stop loss strategies to stop out timely during market penetration.

  4. Appropriately reduce trading frequency to control costs.

Optimization Directions

Some other aspects this strategy can be further optimized:

  1. Add moving stop loss so that stop loss can adjust automatically based on price fluctuation, reducing the chance of stop loss penetration.

  2. Add other indicators or conditions to filter signals, e.g. MACD, Bollinger Bands etc, making signals more reliable.

  3. Use ATR stop loss in high volatile products to automatically adjust stop loss size.

  4. Statistically analyze products and optimize RSI parameters based on product characteristics.

  5. Use machine learning like regression analysis to study optimal RSI and candlestick parameters combination for best strategy performance.

  6. Add adaptive adjustment functionality for RSI parameters and stop loss size, enabling dynamic strategy parameter optimization.

Through these optimizations, trading risks can be reduced, strategy robustness improved, and adaptiveness to market enhanced.

Summary

In summary, this strategy identifies price reversal points using RSI and candlestick patterns to catch trends at turning points. It combines two types of analysis methods to generate trading signals. The strategy has advantages like high trading frequency and strong flexibility. But there are also risks like false signals and stop loss penetration. By optimizing parameters, controlling risks etc, these weaknesses can be improved. There is room for further enhancing this strategy. Through continuous optimization and refinement, it can become a robust and reliable trading strategy.


/*backtest
start: 2023-01-29 00:00:00
end: 2024-02-04 00:00:00
period: 1d
basePeriod: 1h
exchanges: [{"eid":"Futures_Binance","currency":"BTC_USDT"}]
*/

//@version=4
strategy("EngulfingCandle Strategy", overlay=true)

// Your existing definitions
bullishCandle=close >= open[1] and close[1] < open[1]
bearishCandle=close <= open[1] and close[1] > open[1]

// RSI Definitions
rsiSource=input(close, title="rsiSource")
rsiLenghth=input(14, title="rsi length", type=input.integer)
rsiOverBought=input(70, title="rsi overbought level", type=input.integer)
rsiOverSold=input(30, title="rsi over sold level", type=input.integer)

rsiValue=rsi(rsiSource, rsiLenghth)
isRSIOB=rsiValue >= rsiOverBought
isRSIOS=rsiValue <= rsiOverSold

// Trade Signal
tradeSignal=((isRSIOS or isRSIOS[1] or isRSIOS[2]) and bullishCandle ) or ((isRSIOB or isRSIOB[1] or isRSIOB[2]) and bearishCandle)

// Stop Loss and Take Profit Inputs
sl_pips = input(20, title="Stop Loss (in pips)")
tp_pips = input(40, title="Take Profit (in pips)")

// Calculating Stop Loss and Take Profit Prices
long_sl = close - syminfo.mintick * sl_pips
long_tp = close + syminfo.mintick * tp_pips
short_sl = close + syminfo.mintick * sl_pips
short_tp = close - syminfo.mintick * tp_pips

// Entering and Exiting Trades
if (tradeSignal and bullishCandle)
    strategy.entry("Long", strategy.long)
    strategy.exit("Exit Long", "Long", stop=long_sl, limit=long_tp)
    
if (tradeSignal and bearishCandle)
    strategy.entry("Short", strategy.short)
    strategy.exit("Exit Short", "Short", stop=short_sl, limit=short_tp)

// Plotting
plotshape(tradeSignal and bullishCandle, title="Bullish", location=location.belowbar, color=color.green, style=shape.triangleup, text="Buy")
plotshape(tradeSignal and bearishCandle, title="Bearish", location=location.abovebar, color=color.red, style=shape.triangledown, text="Sell")

template: strategy.tpl:40:21: executing "strategy.tpl" at <.api.GetStrategyListByName>: wrong number of args for GetStrategyListByName: want 7 got 6