概述
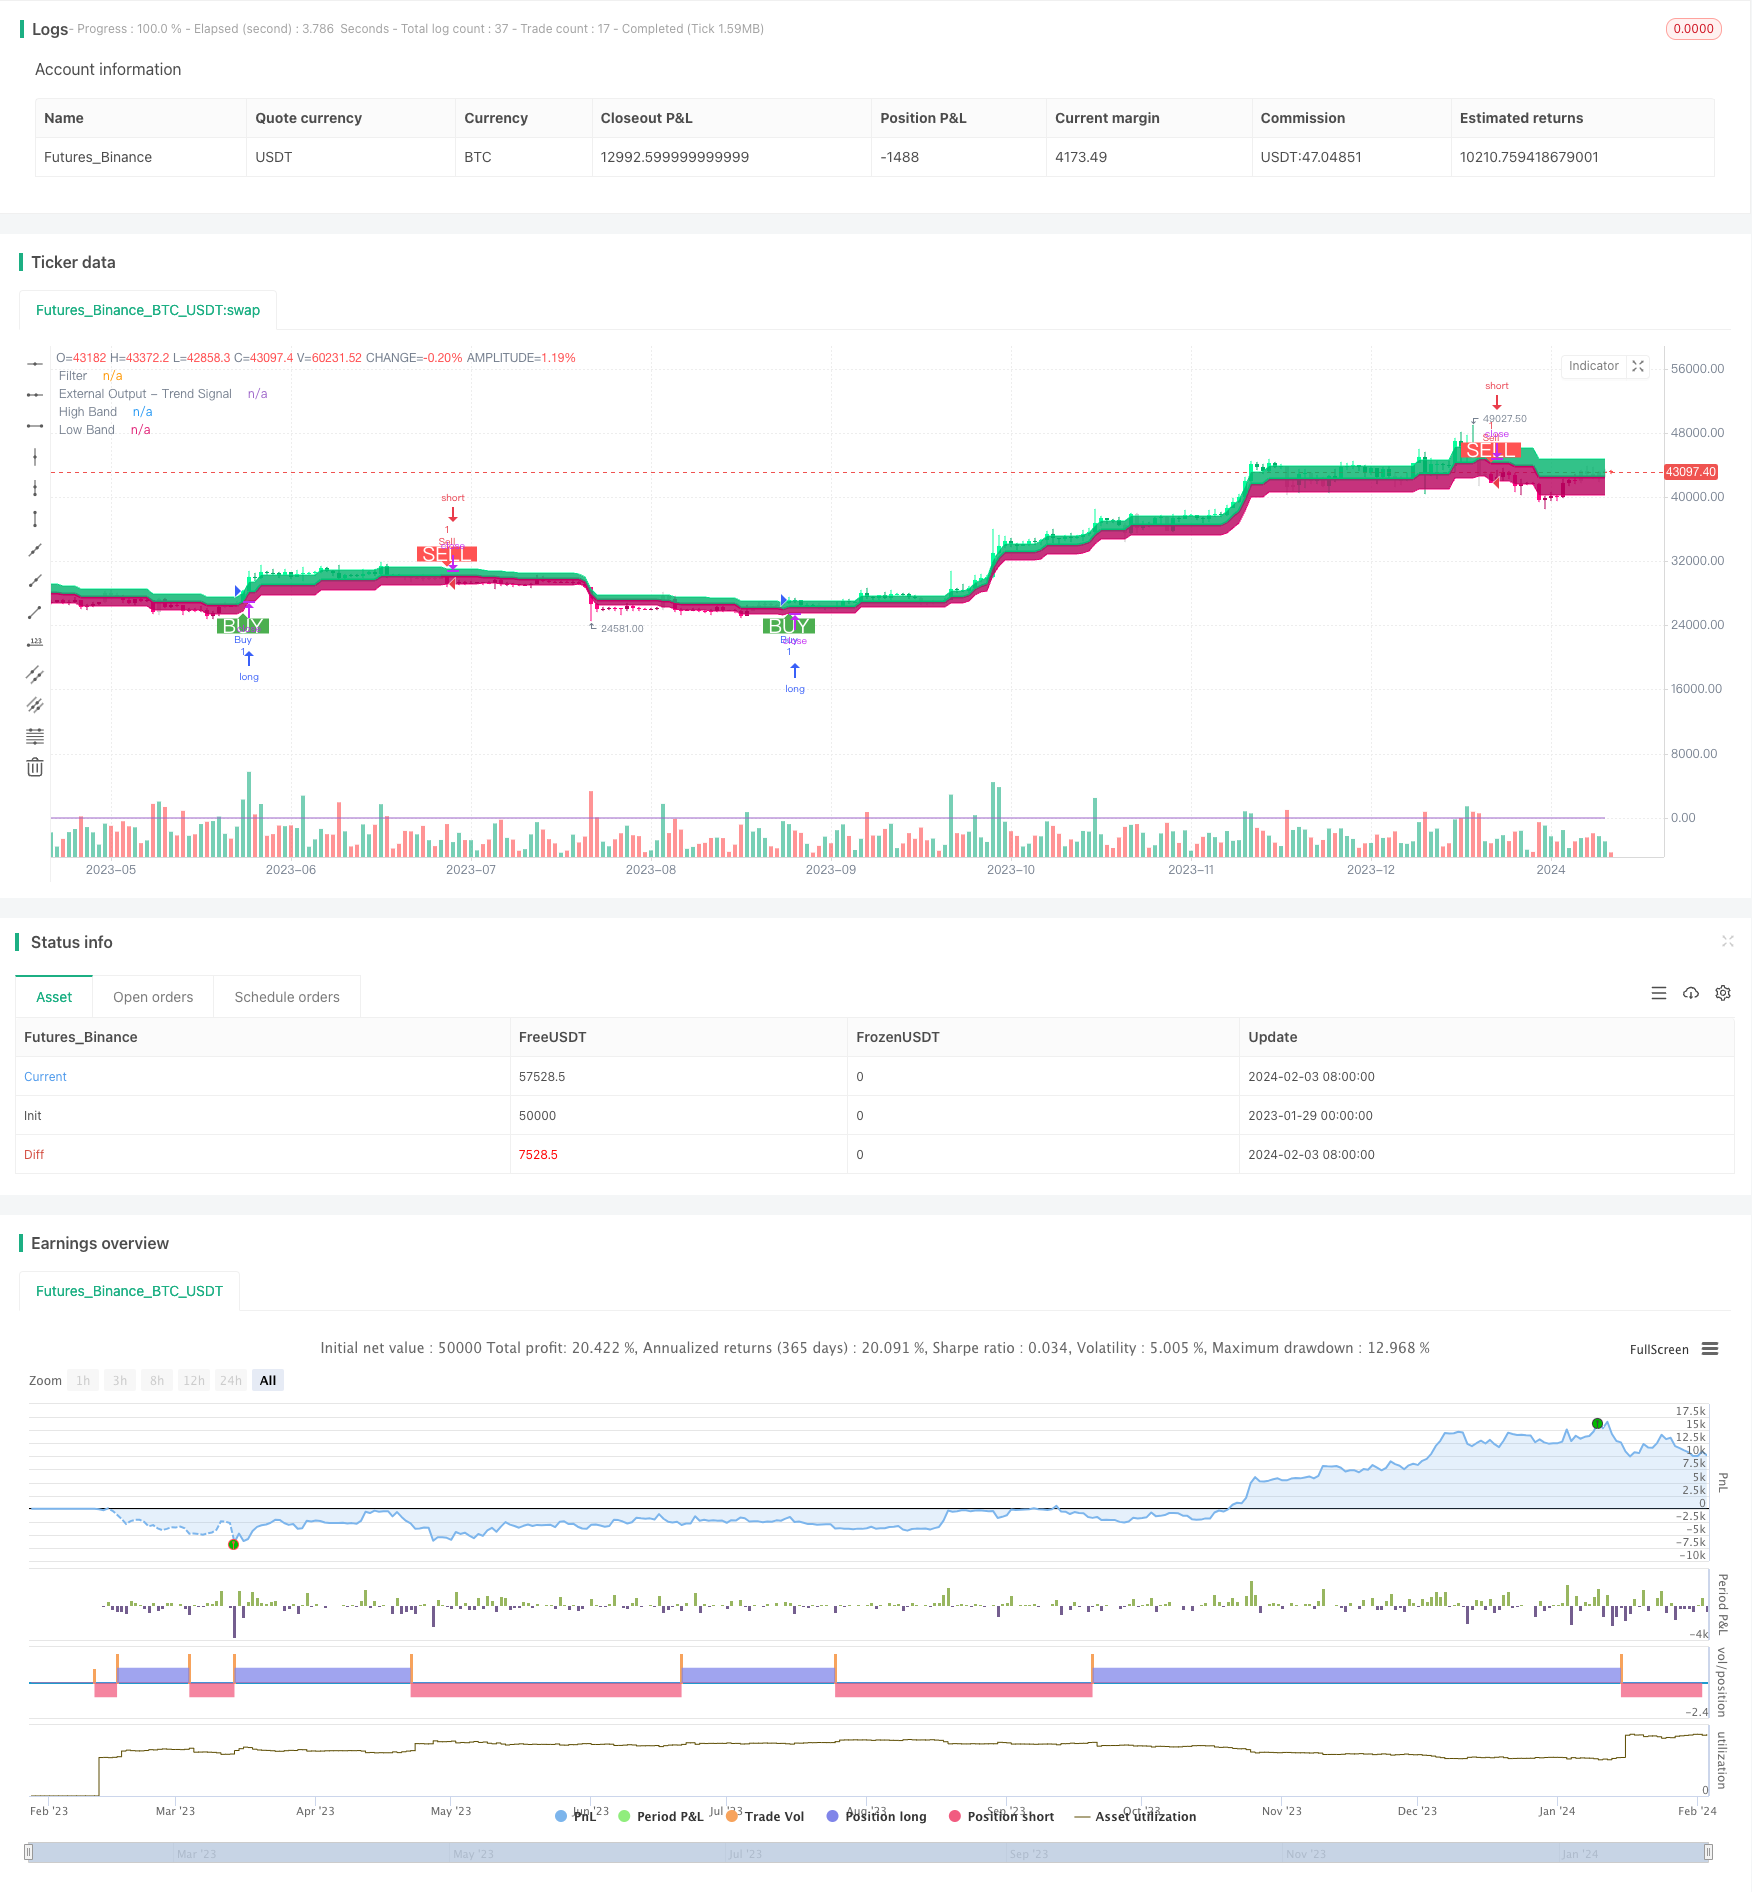
双范围过滤趋势跟踪策略(Dual Range Filter Trend Tracking Strategy)是一个利用双EMA范围过滤来识别趋势方向,并跟踪趋势的量化交易策略。该策略结合双均线过滤和ATR范围计算,可以有效识别中长线趋势的方向,并利用追踪止损来锁定利润。
策略原理
该策略的核心是双EMA范围过滤。它计算K线的ATR范围并平滑,然后结合两个EMA来定位K线在范围内的位置,判断目前是否处在趋势之中。当价格突破范围时,就表明趋势发生转变。
具体来说,策略首先计算K线的ATR范围大小,然后结合两个EMA对其进行平滑。ATR范围代表了K线的正常波动区间。当价格超出这个区间时,就意味着趋势发生变化。策略会记录价格突破EMA范围的方向。当方向发生变化时,说明趋势转折,这时可以选择进入场内。
在进场后,策略利用浮动止损来锁定利润。在持仓期间,它会实时判断K线是否回落超出范围之外,如果发生回落就会退出当前头寸。这可以有效锁定趋势交易的利润。
优势分析
双范围过滤趋势跟踪策略结合了均线过滤和范围计算的优势,可以准确判断趋势的方向,避免在震荡行情中频繁进出场。具体优势如下:
- 利用ATR原理判断K线波动范围,避免在震荡市场无方向进入场内
- 双EMA过滤提高判断准确性,降低假信号
- 实时浮动止损,可以有效锁定趋势利润
- 策略逻辑简单清晰,容易理解和优化
风险分析
该策略也存在一些风险,主要集中在以下几个方面:
- 大幅度跳空可以击穿ATR范围,导致提前入场
- 强势趋势行情中,止损可能过早被触发
- 参数设置不当也会影响策略表现
对于这些风险,可以通过适当优化参数、防止假突破、判断趋势强度等方法来解决。
优化建议
双范围过滤趋势跟踪策略还具备进一步优化的潜力,主要的优化方向包括:
- 优化ATR参数,平滑K线波动范围
- 结合交易量指标避免假突破
- 判断趋势强度,区分单次突破和可持续趋势
- 优化止损点位,在保证利润的前提下追踪长趋势
通过这些优化,可以使策略在更多市场环境下获得稳定收益。
总结
双范围过滤趋势跟踪策略整合了均线过滤和ATR范围判断的多种优点,可以有效识别中长线可持续趋势的方向和入场时机。它只在趋势发生变化时进入场内,并利用浮动止损来锁定利润。该策略逻辑简洁清晰,非常适合中长线趋势交易。通过持续优化参数和判断规则,该策略可以在多种市场中获得较好收益。
策略源码
/*backtest
start: 2023-01-29 00:00:00
end: 2024-02-04 00:00:00
period: 1d
basePeriod: 1h
exchanges: [{"eid":"Futures_Binance","currency":"BTC_USDT"}]
*/

//@version=4
strategy("Range Filter [DW] & Labels", shorttitle="RF [DW] & Labels", overlay=true)

//Conditional Sampling EMA Function
Cond_EMA(x, cond, n)=>
    var val     = array.new_float(0)
    var ema_val = array.new_float(1)
    if cond
        array.push(val, x)
        if array.size(val) > 1
            array.remove(val, 0)
        if na(array.get(ema_val, 0))
            array.fill(ema_val, array.get(val, 0))
        array.set(ema_val, 0, (array.get(val, 0) - array.get(ema_val, 0))*(2/(n + 1)) + array.get(ema_val, 0))
    EMA = array.get(ema_val, 0)
    EMA

//Conditional Sampling SMA Function
Cond_SMA(x, cond, n)=>
    var vals = array.new_float(0)
    if cond
        array.push(vals, x)
        if array.size(vals) > n
            array.remove(vals, 0)
    SMA = array.avg(vals)
    SMA

//Standard Deviation Function
Stdev(x, n)=>
    sqrt(Cond_SMA(pow(x, 2), 1, n) - pow(Cond_SMA(x, 1, n), 2))

//Range Size Function
rng_size(x, scale, qty, n)=>
    ATR      = Cond_EMA(tr(true), 1, n)
    AC       = Cond_EMA(abs(x - x[1]), 1, n)
    SD       = Stdev(x, n)
    rng_size = scale=="Pips" ? qty*0.0001 : scale=="Points" ? qty*syminfo.pointvalue : scale=="% of Price" ? close*qty/100 : scale=="ATR" ? qty*ATR :
               scale=="Average Change" ? qty*AC : scale=="Standard Deviation" ? qty*SD : scale=="Ticks" ? qty*syminfo.mintick : qty

//Two Type Range Filter Function
rng_filt(h, l, rng_, n, type, smooth, sn, av_rf, av_n)=>
    rng_smooth = Cond_EMA(rng_, 1, sn)
    r          = smooth ? rng_smooth : rng_
    var rfilt  = array.new_float(2, (h + l)/2)
    array.set(rfilt, 1, array.get(rfilt, 0))
    if type=="Type 1"
        if h - r > array.get(rfilt, 1)
            array.set(rfilt, 0, h - r)
        if l + r < array.get(rfilt, 1)
            array.set(rfilt, 0, l + r)
    if type=="Type 2"
        if h >= array.get(rfilt, 1) + r
            array.set(rfilt, 0, array.get(rfilt, 1) + floor(abs(h - array.get(rfilt, 1))/r)*r)
        if l <= array.get(rfilt, 1) - r
            array.set(rfilt, 0, array.get(rfilt, 1) - floor(abs(l - array.get(rfilt, 1))/r)*r)
    rng_filt1 = array.get(rfilt, 0)
    hi_band1  = rng_filt1 + r
    lo_band1  = rng_filt1 - r
    rng_filt2 = Cond_EMA(rng_filt1, rng_filt1 != rng_filt1[1], av_n)
    hi_band2  = Cond_EMA(hi_band1, rng_filt1 != rng_filt1[1], av_n)
    lo_band2  = Cond_EMA(lo_band1, rng_filt1 != rng_filt1[1], av_n)
    rng_filt  = av_rf ? rng_filt2 : rng_filt1
    hi_band   = av_rf ? hi_band2 : hi_band1
    lo_band   = av_rf ? lo_band2 : lo_band1
    [hi_band, lo_band, rng_filt]

//-----------------------------------------------------------------------------------------------------------------------------------------------------------------
//Inputs
//-----------------------------------------------------------------------------------------------------------------------------------------------------------------

//Filter Type
f_type = input(defval="Type 1", options=["Type 1", "Type 2"], title="Filter Type")

//Movement Source
mov_src = input(defval="Close", options=["Wicks", "Close"], title="Movement Source")

//Range Size Inputs
rng_qty   = input(defval=2.618, minval=0.0000001, title="Range Size")
rng_scale = input(defval="Average Change", options=["Points", "Pips", "Ticks", "% of Price", "ATR", "Average Change", "Standard Deviation", "Absolute"], title="Range Scale")

//Range Period
rng_per = input(defval=14, minval=1, title="Range Period (for ATR, Average Change, and Standard Deviation)")

//Range Smoothing Inputs
smooth_range = input(defval=true, title="Smooth Range")
smooth_per   = input(defval=27, minval=1, title="Smoothing Period")

//Filter Value Averaging Inputs
av_vals    = input(defval=true, title="Average Filter Changes")
av_samples = input(defval=2, minval=1, title="Number Of Changes To Average")

// New inputs for take profit and stop loss
take_profit_percent = input(defval=100.0, minval=0.1, maxval=1000.0, title="Take Profit Percentage", step=0.1)
stop_loss_percent = input(defval=100, minval=0.1, maxval=1000.0, title="Stop Loss Percentage", step=0.1)

//-----------------------------------------------------------------------------------------------------------------------------------------------------------------
//Definitions
//-----------------------------------------------------------------------------------------------------------------------------------------------------------------

//High And Low Values
h_val = mov_src=="Wicks" ? high : close
l_val = mov_src=="Wicks" ? low : close

//Range Filter Values
[h_band, l_band, filt] = rng_filt(h_val, l_val, rng_size((h_val + l_val)/2, rng_scale, rng_qty, rng_per), rng_per, f_type, smooth_range, smooth_per, av_vals, av_samples)

//Direction Conditions
var fdir = 0.0
fdir    := filt > filt[1] ? 1 : filt < filt[1] ? -1 : fdir
upward   = fdir==1 ? 1 : 0
downward = fdir==-1 ? 1 : 0

//Colors
filt_color = upward ? #05ff9b : downward ? #ff0583 : #cccccc
bar_color  = upward and (close > filt) ? (close > close[1] ? #05ff9b : #00b36b) :
             downward and (close < filt) ? (close < close[1] ? #ff0583 : #b8005d) : #cccccc

//-----------------------------------------------------------------------------------------------------------------------------------------------------------------
//Outputs
//-----------------------------------------------------------------------------------------------------------------------------------------------------------------

//Filter Plot
filt_plot = plot(filt, color=filt_color, transp=0, linewidth=3,  title="Filter")

//Band Plots
h_band_plot = plot(h_band, color=#05ff9b, transp=100, title="High Band")
l_band_plot = plot(l_band, color=#ff0583, transp=100, title="Low Band")

//Band Fills
fill(h_band_plot, filt_plot, color=#00b36b, transp=85, title="High Band Fill")
fill(l_band_plot, filt_plot, color=#b8005d, transp=85, title="Low Band Fill")

//Bar Color
barcolor(bar_color)

//External Trend Output
plot(fdir, transp=100, editable=false, display=display.none, title="External Output - Trend Signal")

// Trading Conditions Logic
longCond = close > filt and close > close[1] and upward > 0 or close > filt and close < close[1] and upward > 0
shortCond = close < filt and close < close[1] and downward > 0 or close < filt and close > close[1] and downward > 0

CondIni = 0
CondIni := longCond ? 1 : shortCond ? -1 : CondIni[1]
longCondition = longCond and CondIni[1] == -1
shortCondition = shortCond and CondIni[1] == 1

// Strategy Entry and Exit
strategy.entry("Buy", strategy.long, when = longCondition)
strategy.entry("Sell", strategy.short, when = shortCondition)

// New: Close conditions based on percentage change
long_take_profit_condition = close > strategy.position_avg_price * (1 + take_profit_percent / 100)
short_take_profit_condition = close < strategy.position_avg_price * (1 - take_profit_percent / 100)

long_stop_loss_condition = close < strategy.position_avg_price * (1 - stop_loss_percent / 100)
short_stop_loss_condition = close > strategy.position_avg_price * (1 + stop_loss_percent / 100)

strategy.close("Buy", when = shortCondition or long_take_profit_condition or long_stop_loss_condition)
strategy.close("Sell", when = longCondition or short_take_profit_condition or short_stop_loss_condition)

// Plot Buy and Sell Labels
plotshape(longCondition, title = "Buy Signal", text ="BUY", textcolor = color.white, style=shape.labelup, size = size.normal, location=location.belowbar, color = color.green, transp = 0)
plotshape(shortCondition, title = "Sell Signal", text ="SELL", textcolor = color.white, style=shape.labeldown, size = size.normal, location=location.abovebar, color = color.red, transp = 0)

// Alerts
alertcondition(longCondition, title="Buy Alert", message = "BUY")
alertcondition(shortCondition, title="Sell Alert", message = "SELL")