概述
该策略是基于布林带的双轨道突破交易策略。它使用布林带的上轨和下轨作为买入和卖出信号,并设定了止损点以控制风险。
策略原理
该策略使用布林带的上轨和下轨线。布林带是由均线及其对应的两个标准差通道组成。当价格接触或突破布林带上轨时产生卖出信号;当价格接触或突破布林带下轨时产生买入信号。 此外,该策略还设置了止损点。当价格低于均线一定比例时,会识别止损。
具体来说,策略通过计算指定周期(如20日)的平均线及其标准差的两倍来绘制布林带。上轨线为平均线加上标准差的两倍,下轨线为平均线减去标准差的两倍。当收盘价大于或等于上轨线时,发出卖出信号;当收盘价小于或等于下轨线时,发出买入信号。此外,如果价格低于平均线的一定比例(如1%),则发出止损信号。
策略优势
该策略利用布林带的特性,在价格出现异常波动时能够发出交易信号,从而抓住价格反转的机会。相比单纯跟踪均线策略,该策略能够在波动加大时产生交易信号,在一定程度上规避了假突破的风险。
与简单的双轨道突破策略相比,该策略增加了止损机制。这能够有效控制个别错误信号造成的损失。止损点的设置也比较合理,距离平均线较近,避免了过于激进的止损造成的过多损失。
策略风险
该策略最大的风险在于布林带本身并不能确保交易信号的有效性。当市场出现特殊情况时,价格可能出现不合理的大幅波动,这时布林带发出的交易信号可能是错误的。此时很可能造成较大的亏损。
另外,止损点的设置也可能过于激进或保守,这都会影响最终的收益。如果止损幅度过大,则有效信号可能会被频繁止损;而如果止损幅度过小,则无法有效控制损失。
策略优化方向
该策略可以从以下几个方面进行优化:
测试不同的参数组合,如均线周期、标准差倍数、止损百分比等的不同数值,寻找最优参数;
增加其他指标判断,形成多重过滤条件,避免错误信号;
优化止损策略,如采用移动止损、分批止损等方式替代简单的止损;
结合不同时间周期的布林带进行交易信号确认,避免被套。
总结
该策略整体来说是一种实用的趋势跟踪和双轨突破结合的策略。它能够在价格波动加大时抓住反转机会,并设置了止损来控制风险。通过参数优化、增加信号过滤以及优化止损策略等手段,可以进一步增强该策略的稳定性和盈利能力。
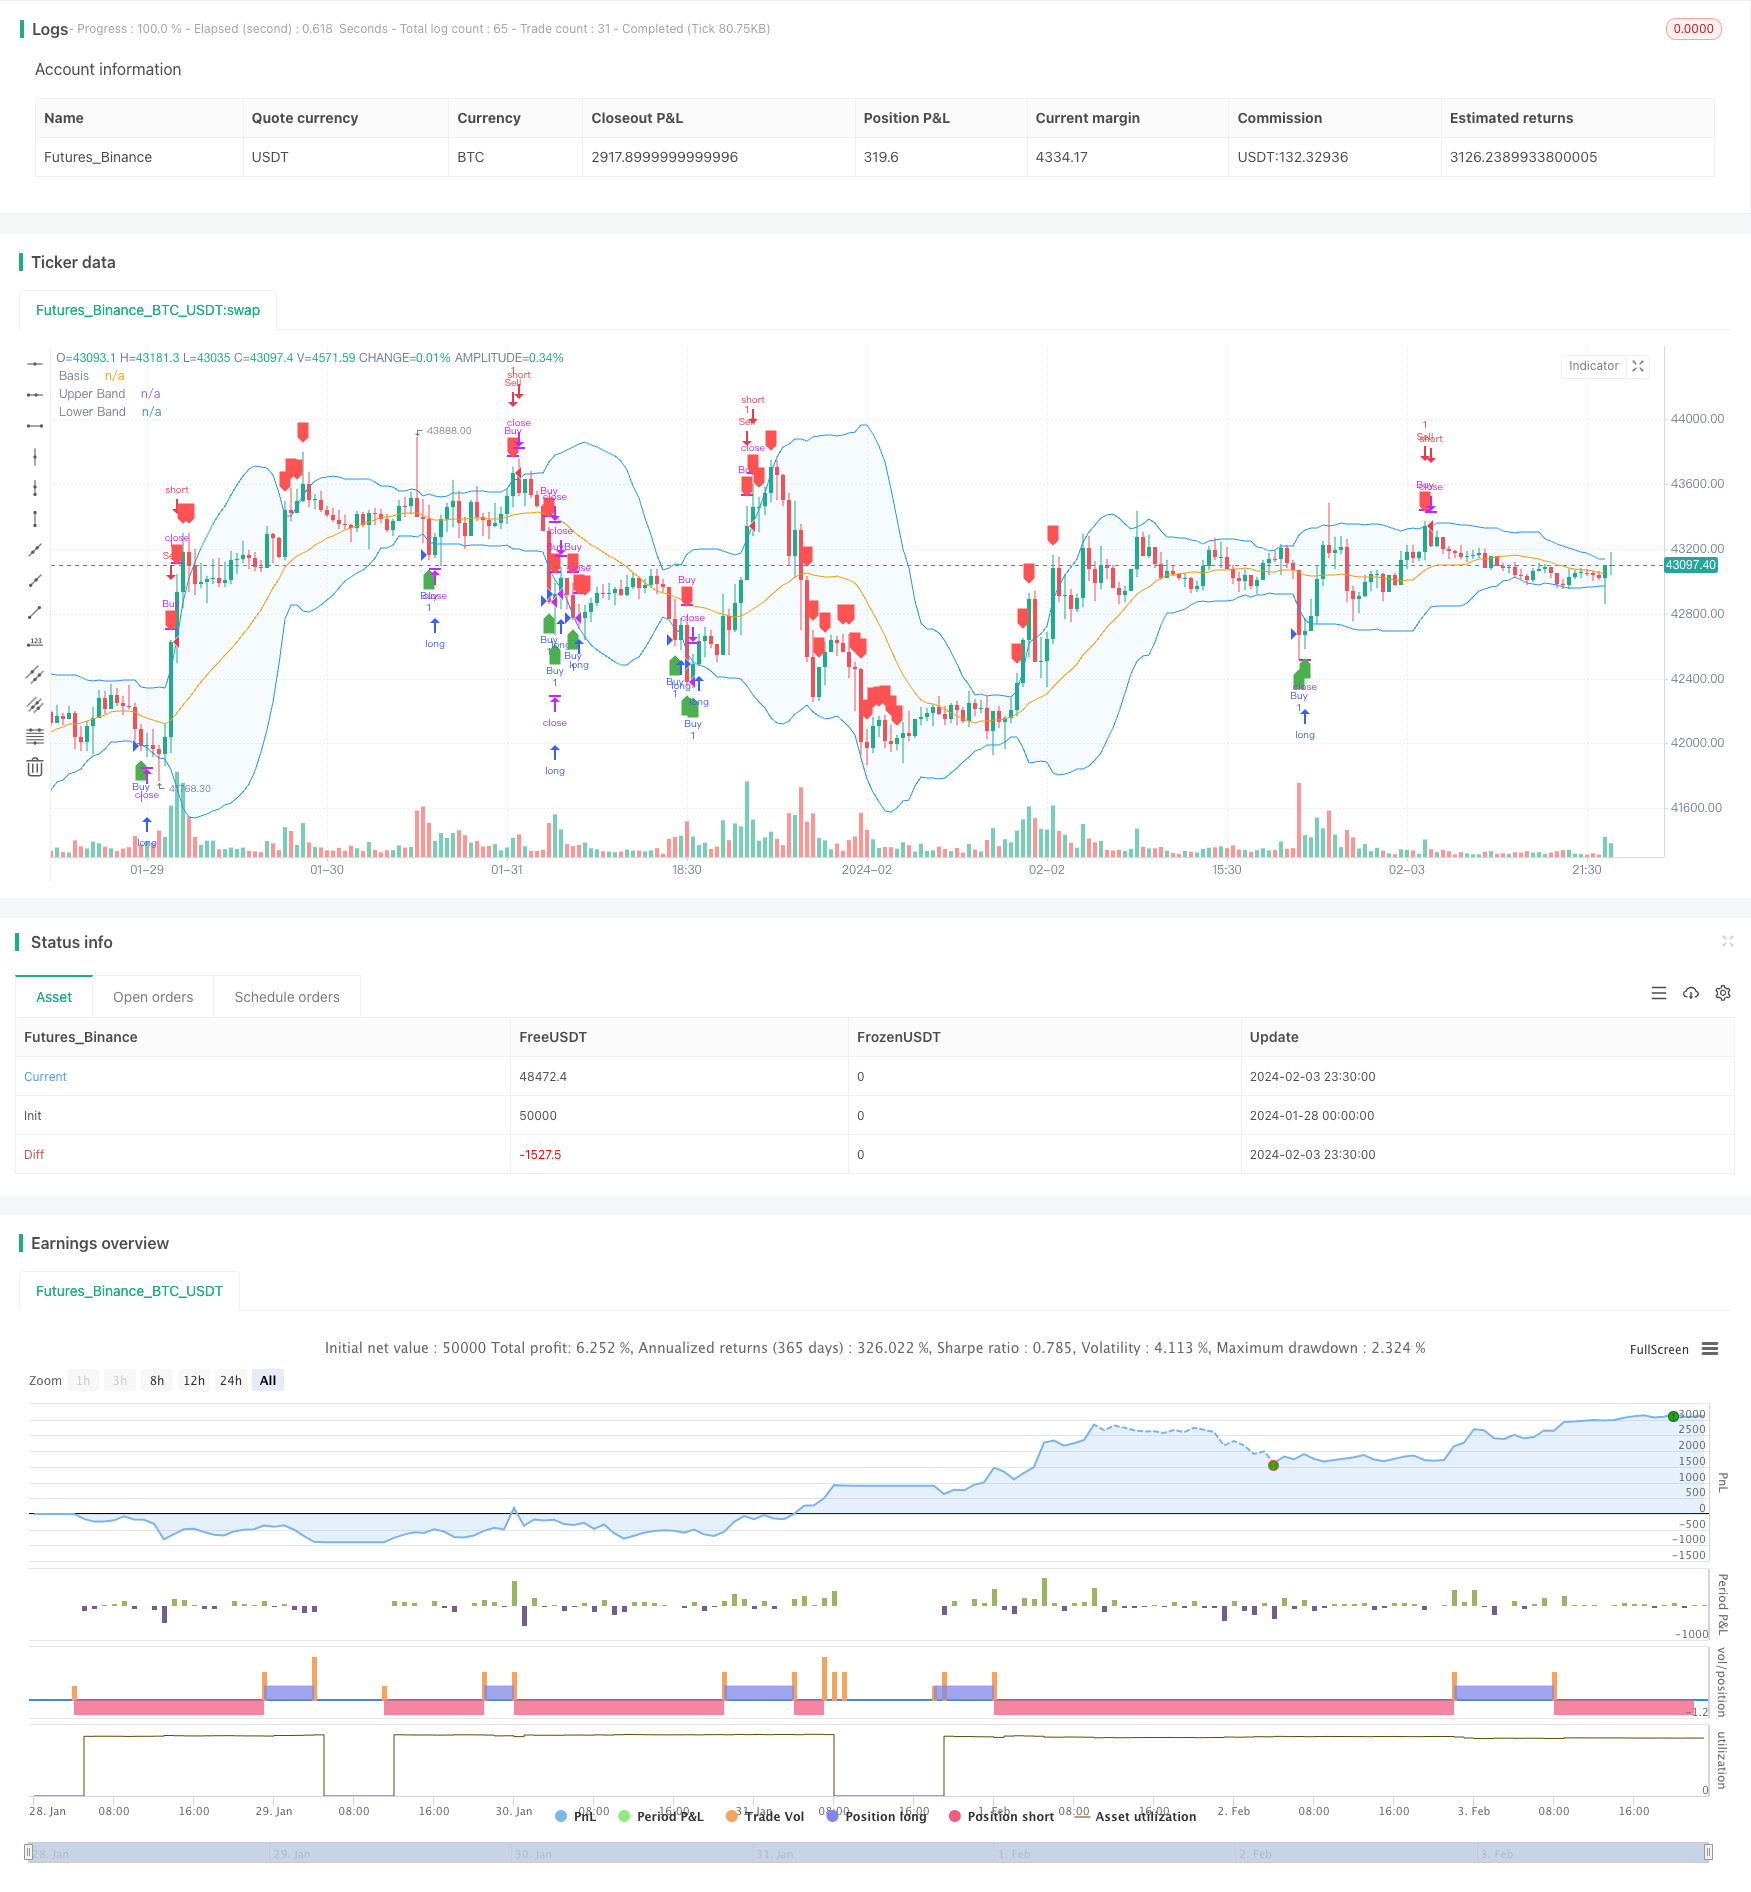
/*backtest
start: 2024-01-28 00:00:00
end: 2024-02-04 00:00:00
period: 30m
basePeriod: 15m
exchanges: [{"eid":"Futures_Binance","currency":"BTC_USDT"}]
*/

//@version=5
strategy("Bollinger Bands Strategy by Royce Mars", overlay=true)

length = input.int(20, minval=1)
maType = input.string("SMA", "Basis MA Type", options = ["SMA", "EMA", "SMMA (RMA)", "WMA", "VWMA"])
src = input(close, title="Source")
mult = input.float(2.0, minval=0.001, maxval=50, title="StdDev")
stopLossPercent = input.float(1.0, title="Stop Loss Percent", minval=0.1, maxval=10, step=0.1)

ma(source, length, _type) =>
    switch _type
        "SMA" => ta.sma(source, length)
        "EMA" => ta.ema(source, length)
        "SMMA (RMA)" => ta.rma(source, length)
        "WMA" => ta.wma(source, length)
        "VWMA" => ta.vwma(source, length)

basis = ma(src, length, maType)
dev = mult * ta.stdev(src, length)
upper = basis + dev
lower = basis - dev

// Buy and Sell Conditions
buyCondition = close <= lower
sellCondition = close >= upper

// Stop Loss Condition
stopLossCondition = close < basis * (1 - stopLossPercent / 100)

// Strategy Execution
strategy.entry("Buy", strategy.long, when=buyCondition)
strategy.close("Buy", when=sellCondition or stopLossCondition)

strategy.entry("Sell", strategy.short, when=sellCondition)
strategy.close("Sell", when=buyCondition)

// Plotting on the Chart
plotshape(buyCondition, title="Buy Signal", color=color.green, style=shape.labelup, location=location.belowbar)
plotshape(sellCondition or stopLossCondition, title="Sell Signal", color=color.red, style=shape.labeldown, location=location.abovebar)

// Plotting the Bollinger Bands
plot(basis, "Basis", color=color.orange)
p1 = plot(upper, "Upper Band", color=color.blue)
p2 = plot(lower, "Lower Band", color=color.blue)
fill(p1, p2, title="Background", color=color.rgb(33, 150, 243, 95))