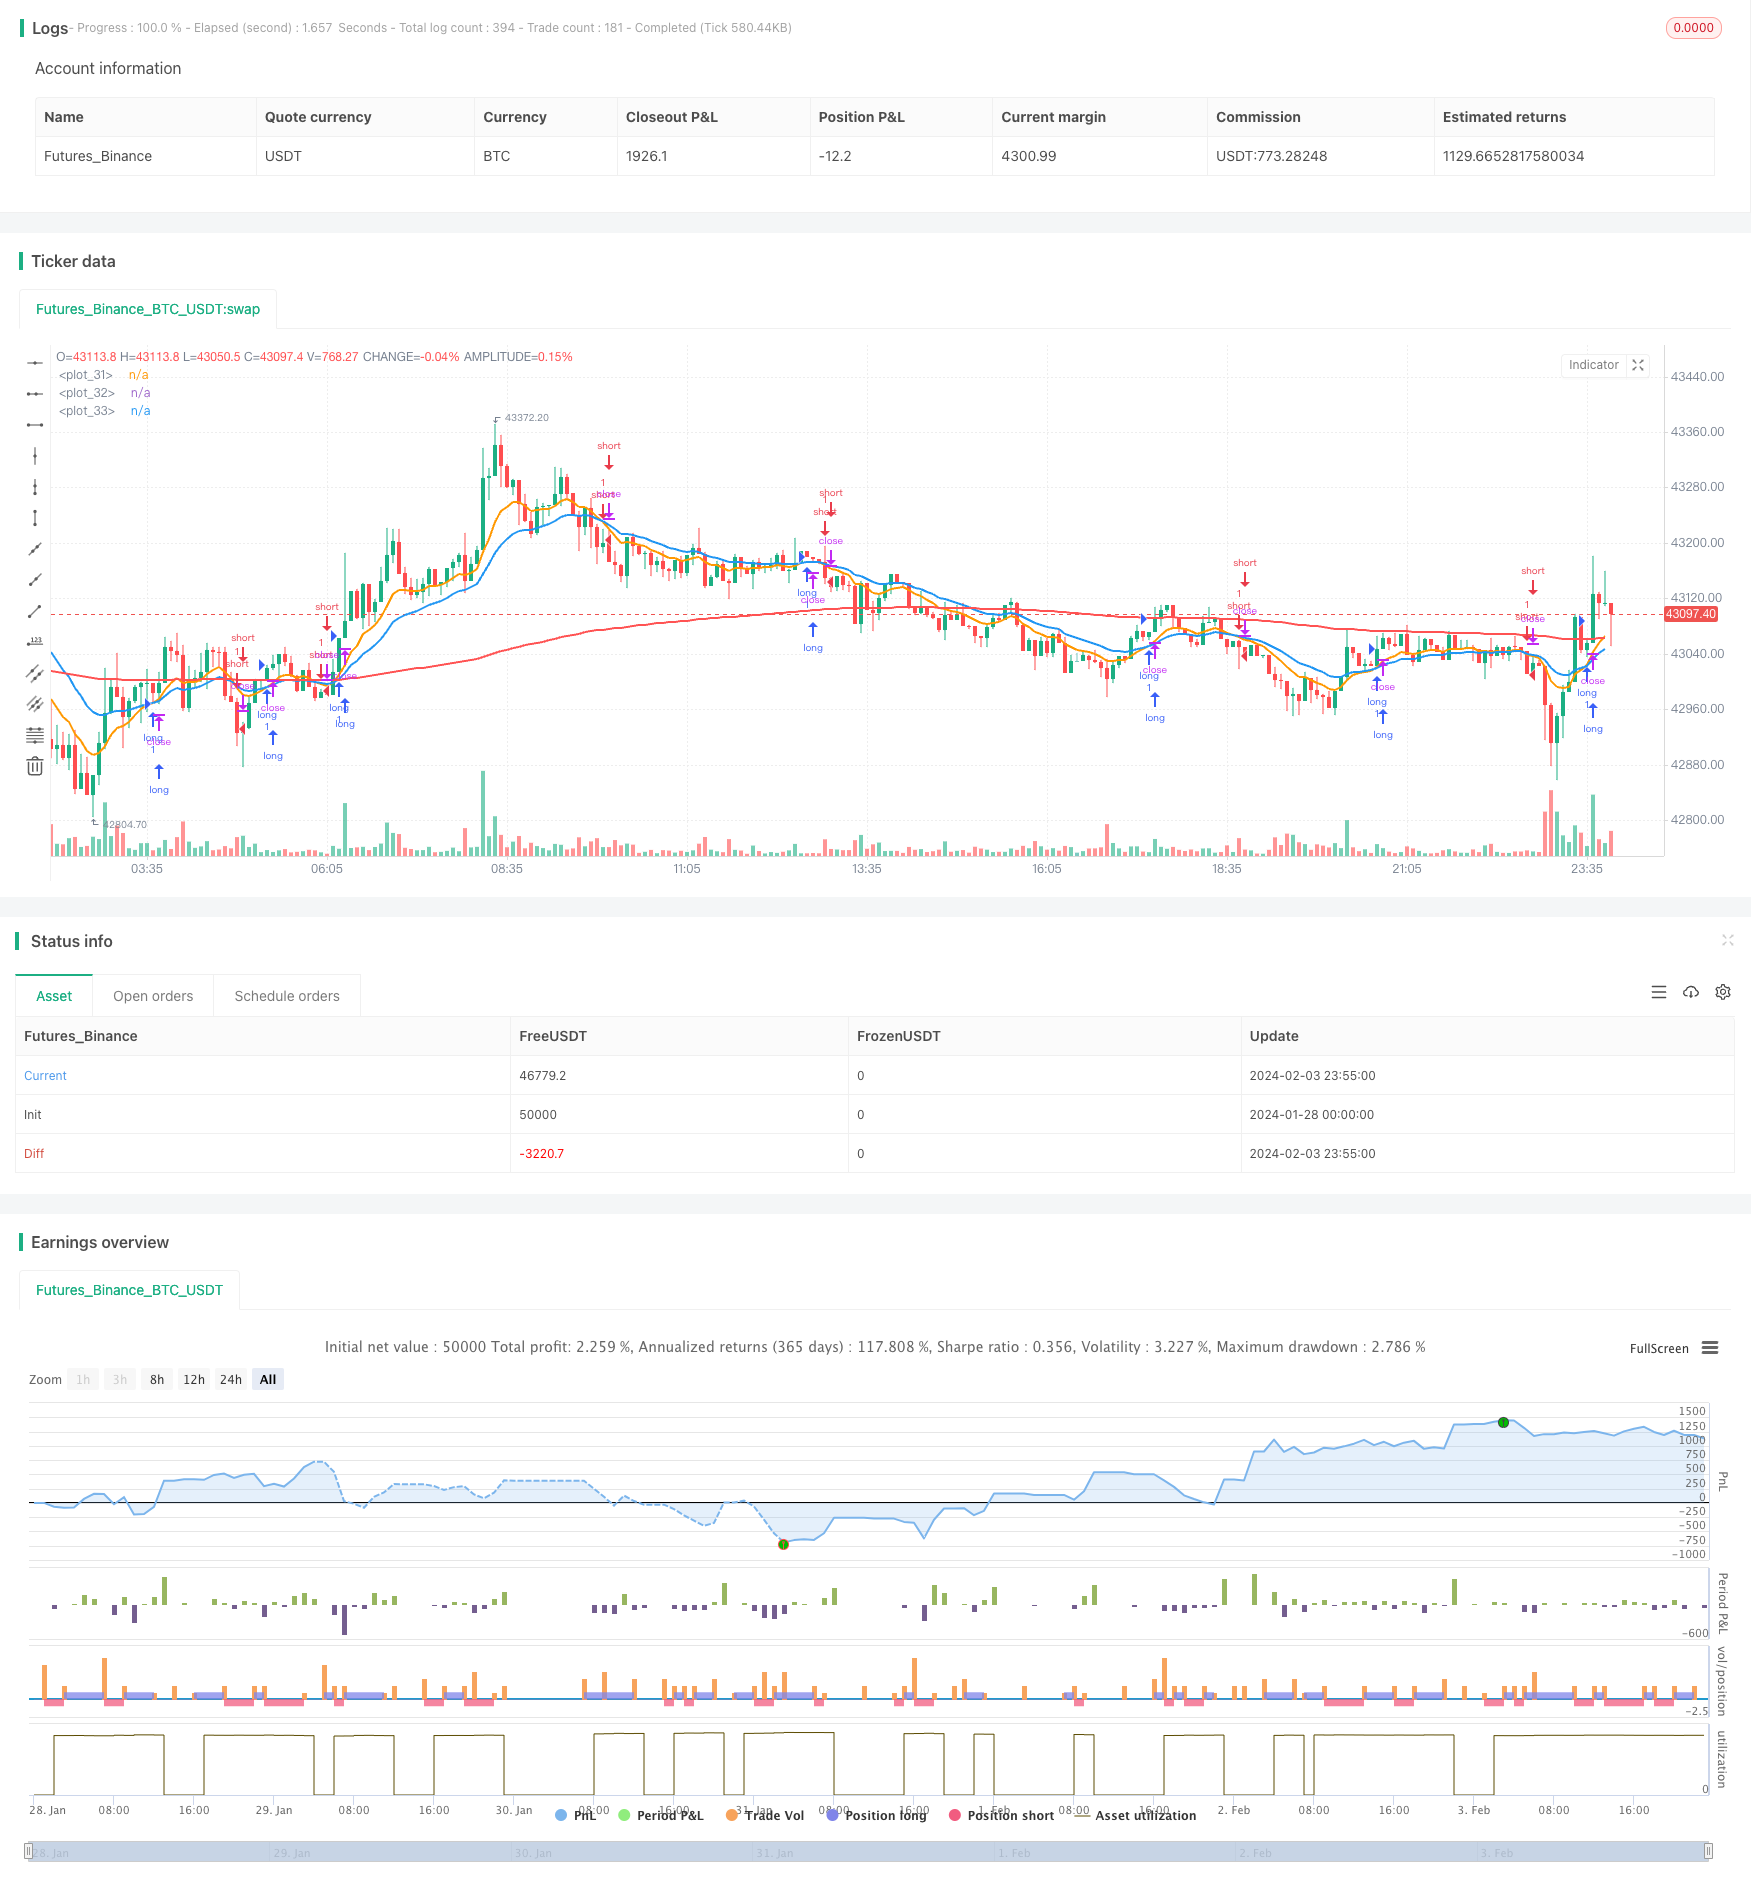
概述
移动均线交叉趋势追踪策略是一种追踪市场趋势的量化交易策略。该策略通过计算快速移动均线和慢速移动均线,并在它们发生交叉时生成交易信号,以捕捉市场趋势的转折点。
策略原理
该策略的核心原理是使用不同参数的指数移动均线(EMA)实现对市场趋势的判断。策略中定义了一个快速EMA和一个慢速EMA。当快速EMA从下方上穿慢速EMA时,表示市场趋势转bull;当快速EMA从上方下穿慢速EMA时,表示市场趋势转bear。
在上穿时,策略会开多单,在下穿时,策略会开空单。策略会一直持有仓位,直到止盈止损触发或者再次发生交叉反向信号。
优势分析
该策略具有以下优势:
- 策略逻辑简单清晰,容易理解实现,适合初学者学习;
- 利用EMA平滑价格,可以有效过滤市场Noise,识别趋势;
- 可以灵活调整参数,适应不同周期的市场;
- 可以将策略扩展为多时间周期版本,提高稳定性。
风险分析
该策略也存在一些风险:
- 在震荡行情中,可能出现多次止损,影响盈利;
- 无法有效识别趋势类型(牛熊),可能亏损严重;
- EMA参数设置不当,会导致交易频率过高或识别延迟。
为了降低风险,可以考虑结合其他指标判断趋势类型,或者设置止损比例更宽松一些。
优化方向
该策略还可以从以下几个方面进行优化:
- 增加对趋势类型的判断,避免反向开仓;
- 增加多时间周期判断,提高信号质量;
- 动态调整止损止盈比例,优化退出点;
- 结合其他指标过滤信号,减少误差交易。
总结
移动均线交叉趋势追踪策略整体来说是一种简单实用的趋势交易策略。该策略核心思想清晰,易于实践,同时也存在一定的优化空间。通过参数调整、多周期判断、动态止损等方式,可以不断提升策略的稳定性和盈利水平。
策略源码
/*backtest
start: 2024-01-28 00:00:00
end: 2024-02-04 00:00:00
period: 5m
basePeriod: 1m
exchanges: [{"eid":"Futures_Binance","currency":"BTC_USDT"}]
*/

//@version=5
strategy('Zhukov trade', overlay=true, calc_on_every_tick=true, currency=currency.USD)

// INPUT:

// Options to enter fast and slow Exponential Moving Average (EMA) values
emaFast = input.int(title='Fast EMA', defval=10, minval=1, maxval=9999)
emaSlow = input.int(title='Slow EMA', defval=20, minval=1, maxval=9999)

// Option to select trade directions
tradeDirection = input.string(title='Trade Direction', options=['Long', 'Short', 'Both'], defval='Both')

// Options that configure the backtest date range
startDate = input(title='Start Date', defval=timestamp('01 Jan 2023 00:00'))
endDate = input(title='End Date', defval=timestamp('31 Dec 2030 23:59'))

// Set take profit and stop loss percentages
take_profit_percent = input(1.0, title ="Take Profit Percent") / 100.0
stop_loss_percent = input(1.0, title ="Stop Loss Percent") / 100.0

// CALCULATIONS:

// Use the built-in function to calculate two EMA lines
fastEMA = ta.ema(close, emaFast)
slowEMA = ta.ema(close, emaSlow)
emapos = ta.ema(close, 200)

// PLOT:

// Draw the EMA lines on the chart
plot(series=fastEMA, color=color.new(color.orange, 0), linewidth=2)
plot(series=slowEMA, color=color.new(color.blue, 0), linewidth=2)
plot(series=emapos, color=color.new(color.red, 0), linewidth=2)

// CONDITIONS:

// Check if the close time of the current bar falls inside the date range
inDateRange = true

// Translate input into trading conditions
longOK = tradeDirection == 'Long' or tradeDirection == 'Both'
shortOK = tradeDirection == 'Short' or tradeDirection == 'Both'

// Decide if we should go long or short using the built-in functions
longCondition = ta.crossover(fastEMA, slowEMA) and inDateRange
shortCondition = ta.crossunder(fastEMA, slowEMA) and inDateRange

// ORDERS:

// Submit entry (or reverse) orders
if longCondition and longOK
    strategy.entry(id='long', direction=strategy.long)

if shortCondition and shortOK
    strategy.entry(id='short', direction=strategy.short)

// Exit orders
if strategy.position_size > 0 and longOK
    strategy.exit(id='exit long', from_entry='long', limit=strategy.position_avg_price * (1 + take_profit_percent), stop=strategy.position_avg_price * (1 - stop_loss_percent))

if strategy.position_size < 0 and shortOK
    strategy.exit(id='exit short', from_entry='short', limit=strategy.position_avg_price * (1 - take_profit_percent), stop=strategy.position_avg_price * (1 + stop_loss_percent))