Camarilla Pivot Points Strategy Based on Bollinger Bands

1
Follow
1782
Followers
Overview
This strategy first calculates the Camarilla pivot points based on the previous trading day's highest price, lowest price and closing price. It then filters the price with Bollinger Bands indicator to generate trading signals when price breaks through the pivot points.
Strategy Logic
- Calculate highest price, lowest price and closing price of previous trading day
- Calculate Camarilla pivot lines including upper rails H4, H3, H2, H1 and lower rails L1, L2, L3, L4 according to formulas
- Calculate 20-day Bollinger Bands upper band and lower band
- Go long when price breaks above lower band, go short when price breaks below upper band
- Set stop loss near Bollinger Bands upper or lower band
Advantage Analysis
- Camarilla pivot lines contain multiple key support and resistance levels to enhance reliability of trading signals
- Combining with Bollinger Bands effectively filters false breakouts
- Multiple parameter combinations make trading flexible
Risk Analysis
- Improper Bollinger Bands parameter settings may cause wrong trading signals
- Camarilla pivot points rely on previous trading day's price, may be impacted by overnight gaps
- Both long and short positions carry loss risks
Optimization Directions
- Optimize Bollinger Bands parameters to find best combination
- Add other indicators to filter false breakout signals
- Increase stop loss strategies to reduce single loss
Summary
This strategy combines Camarilla pivot lines and Bollinger Bands, generating trading signals when price breaks key support and resistance levels. Strategy profitability and stability can be improved through parameter optimization and signal filtering. Overall, this strategy has clear trading logic and high operability, worth live trading verification.
Source
Pine
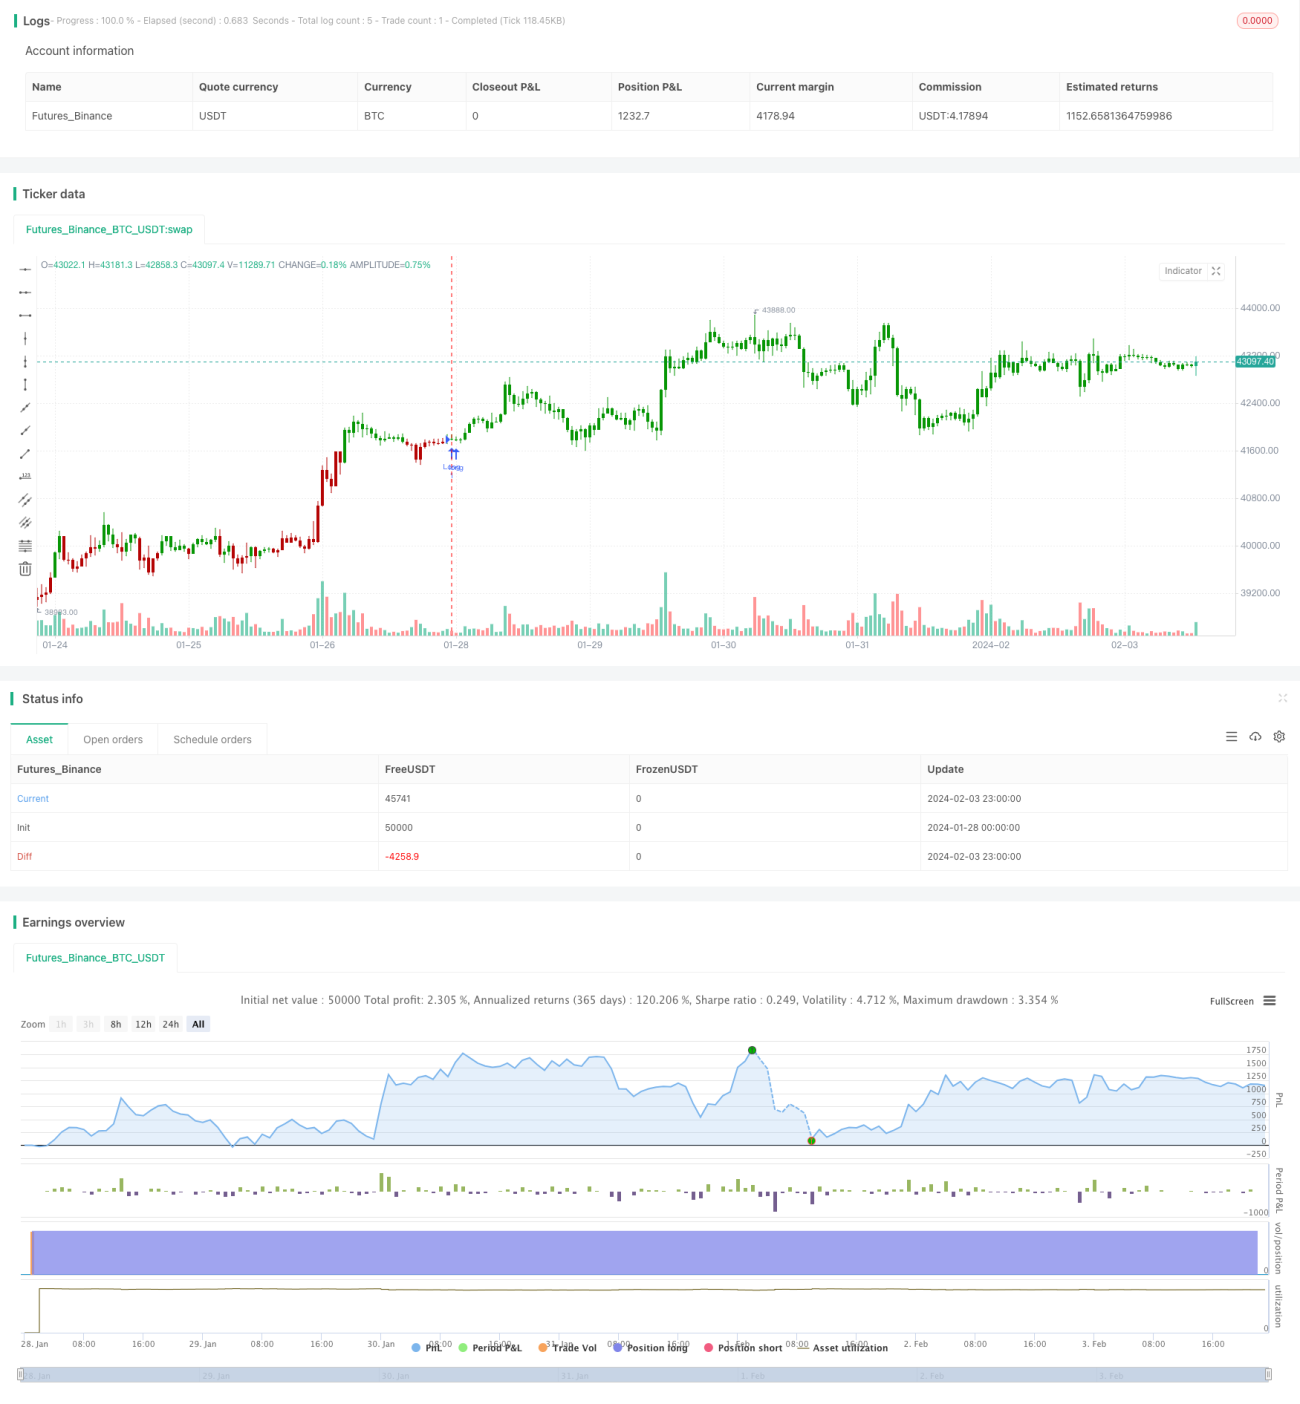
/*backtest
start: 2024-01-28 00:00:00
end: 2024-02-04 00:00:00
period: 1h
basePeriod: 15m
exchanges: [{"eid":"Futures_Binance","currency":"BTC_USDT"}]
*/

//@version=4
////////////////////////////////////////////////////////////
//  Copyright by HPotter v1.0 12/05/2020
// Camarilla pivot point formula is the refined form of existing classic pivot point formula. Strategy parameters
Related strategies
Comment
All comments (0)
No data
- 1