概述
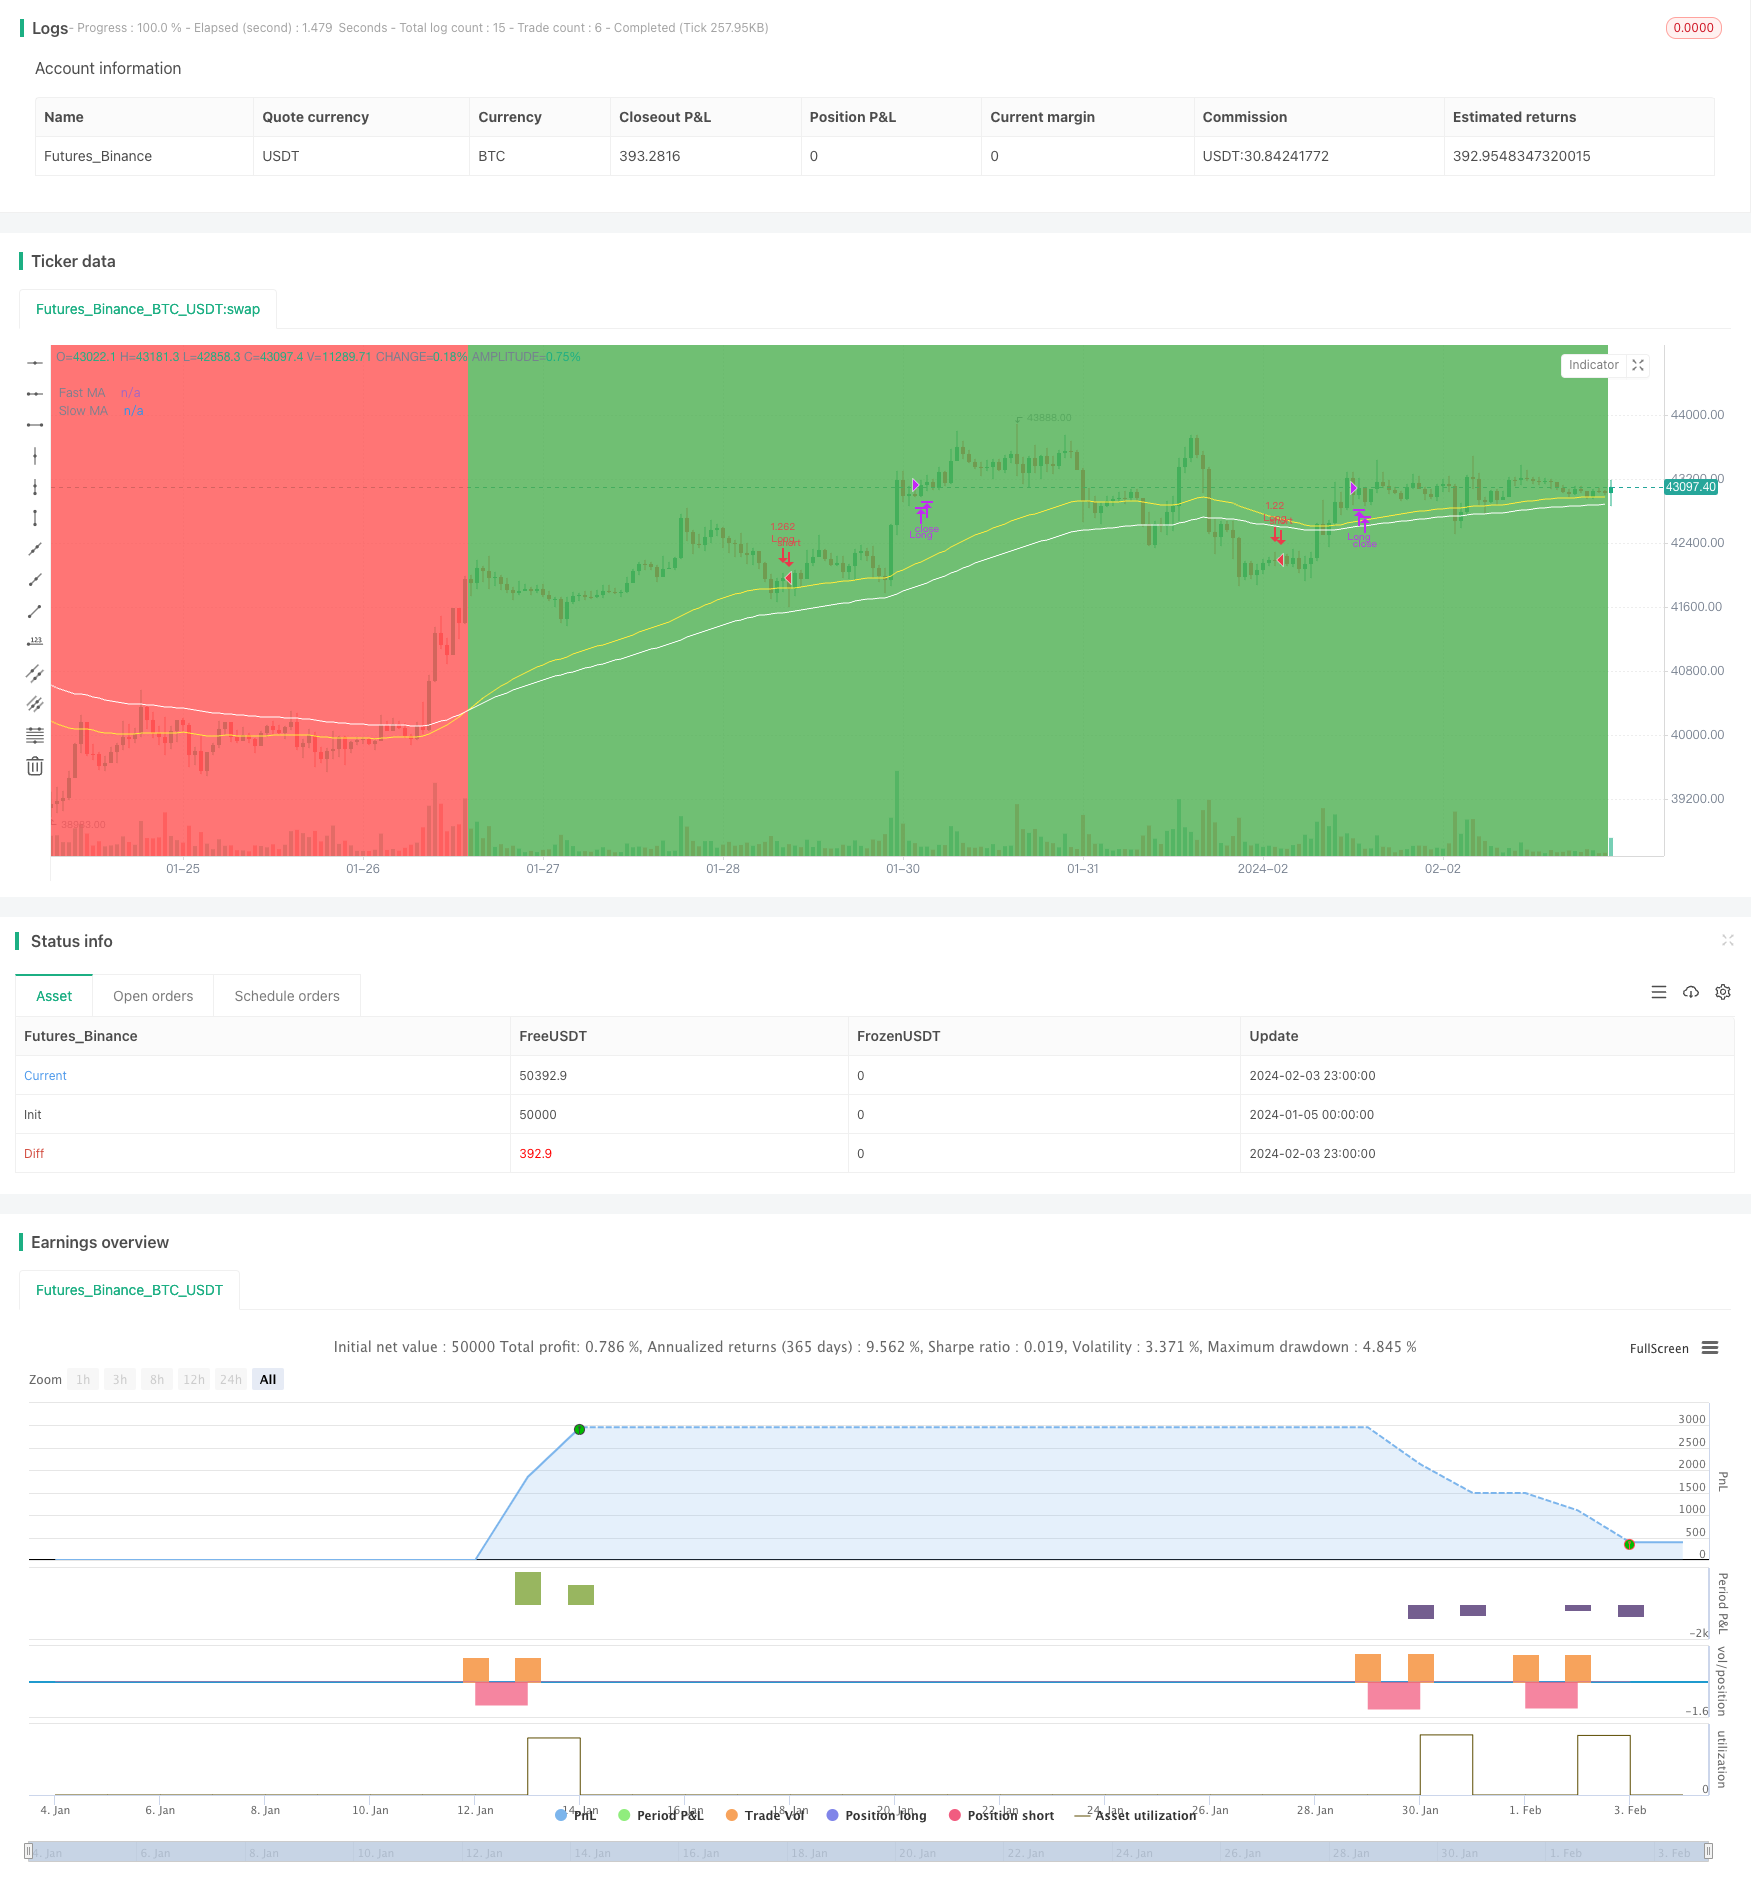
该策略主要利用Stoch指标在超买超卖区域发生的交叉作为入场信号,同时结合EMA指标判断当前趋势方向,只在EMA持续上升的趋势中进行做多操作,在EMA持续下跌的趋势中进行做空操作,属于典型的趋势跟踪策略。
策略原理
该策略主要由三部分组成:
- EMA指标判断趋势方向
使用一快一慢两个不同参数的EMA,当快EMA位于慢EMA之上时判断为上升趋势,当快EMA位于慢EMA之下时判断为下跌趋势。
- Stoch指标判断买卖信号
Stoch指标由%K线和%D线组成,%K线在超买区之上与%D线发生黄金交叉时产生买入信号,%K线在超卖区之下与%D线发生死亡交叉时产生卖出信号。该策略仅在Stoch指标交叉发生在超买超卖区域时才发出交易信号。
- 风险管理机制
该策略同时设定了止损和止盈机制。在持有做多仓位时,如果价格跌破设定的止损位则会止损平仓;如果价格涨破设定的止盈位则会止盈平仓。做空仓位同理。
整体来说,该策略属于比较典型的量化交易策略,利用指标组合判断趋势方向和交易信号,同时辅以严格的风险管理规则,可以有效减少交易风险。
优势分析
该策略主要具有以下优势:
利用EMA判断主次级别的趋势,避免在震荡不明的市场中被套。
Stoch指标的特点在于其能够很好地反映目前是否处在超买或者超卖区域,因此结合交叉信号的产生可以进行超买超卖区域交易。
该策略明确了做多和做空的可能产生的环境,使信号产生得到进一步过滤,降低错误信号的概率,同时也避免在复杂的市场中盲目开仓。
严格的风险管理机制有助于控制单次交易的损失,既控制了整体的最大回撤,同时也为盈利交易留出了足够的空间。
风险分析
该策略也存在一定的风险:
EMA、Stoch等指标都存在一定的滞后性,这会导致该策略难以及时抓住市场反转的机会。
单纯依赖指标容易对市场形成先入为主的判断,从而错过市场实际提供的交易机会。
风险管理机制本身也可能成为策略盈利空间的限制,在大趋势中止损和止盈位的设置需要特别慎重。
在参数选择上该策略也存在一定的风险,不同参数对结果的影响需要通过大量的回测和优化来获得最佳参数组合。
优化方向
该策略可以从以下几个方面进行优化:
尝试不同类型的EMA,例如加权移动平均线、 Hull MA等指标来判断趋势,进行比较分析。
尝试结合其他指标来产生交易信号,例如MACD、KDJ等,构建多指标的交易体系。
优化止损和止盈的设置,使其更加适应市场的实际波动情况。可以设定更宽松的止损位和更严格的止盈位。
测试不同品种和不同周期下该策略表现的差异性,寻找最佳品种和周期组合。
考虑加入机器学习或神经网络模型来辅助判断趋势方向和交易信号,实现策略的智能化。
总结
总的来说,该策略利用常见指标进行组合,构建了一套比较成熟的趋势跟踪交易策略。它既考虑了趋势判断和具体交易信号的产生,也设置了风险管理机制。通过继续优化,相信该策略可以取得更好的实盘效果。与此同时,我们也要意识到单一策略的局限性,继续学习和探索市场奥秘,才能取得长期稳定的收益。
/*backtest
start: 2024-01-05 00:00:00
end: 2024-02-04 00:00:00
period: 1h
basePeriod: 15m
exchanges: [{"eid":"Futures_Binance","currency":"BTC_USDT"}]
*/

//@version=2
//by Wugamlo
//Strategy combining Stochastic Crosses in the Overbought/Oversold Area with a trend determined by two EMAs
//Default setup seems to work best on 4HR timeframe for BTC

strategy(title = "Strategy Stoch/EMA Cross", shorttitle = "Strategy Stoch/EMA Cross", overlay = true, pyramiding = 0, default_qty_type = strategy.percent_of_equity, default_qty_value = 100, currency = currency.USD, commission_value=0.01,commission_type=strategy.commission.percent, initial_capital=1000)

// === GENERAL INPUTS ===
SectionInd      = input(defval = true ,title = "════════════ INDICATORS ════════════")
maFastLength    = input(defval = 55,   title = "Fast MA Period", minval = 1)
maSlowLength    = input(defval = 89,   title = "Slow MA Period", minval = 1)
StochLength     = input(defval = 14,   title = "Stochastic Length", minval=1)
smoothK         = input(defval = 6,    title = "%K Smooth", minval=1)
smoothD         = input(defval = 3,    title = "%D Smooth", minval=1)
overbought      = 80
oversold        = 20
HighlightOBOS   = input(defval = true, title = "Highlight Stoch Cross?")
HighlightTrend  = input(defval = true, title = "Highlight Trend?")

//DATE AND TIME
SectionFrom     = input(defval = true ,title = "═══════════════ FROM ═══════════════")
fromDay         = input(defval = 01,   title = "From day", minval=1)
fromMonth       = input(defval = 1,    title = "From month", minval=1)
fromYear        = input(defval = 2019, title = "From year", minval=2014)
SectionTo       = input(defval = true, title = "════════════════ TO ════════════════")
toDay           = input(defval = 31,   title = "To day", minval=1)
toMonth         = input(defval = 12,    title = "To month", minval=1)
toYear          = input(defval = 2020, title = "To year", minval=2014)

// === STRATEGY RELATED INPUTS ===
SectionStra     = input(defval = true ,title = "═════════════ STRATEGY ═════════════")

// Include Shorts or only trade Long Positions?
includeShorts   = input(defval = true, title = "Include Short Positions?")


// Risk Management inputs
useTakeProfit   = input(defval = true,  title = "User Take Profit?")
inpTakeProfit   = input(defval = 8,     title = "Take Profit (%)", minval = 0)
useStopLoss     = input(defval = false, title = "User Stop Loss?")
inpStopLoss     = input(defval = 2,     title = "Stop Loss (%)", minval = 0)

StopLossPerc    = inpStopLoss * 0.01
TakeProfitPerc  = inpTakeProfit * 0.01


// === EMA SERIES SETUP ===
maFast = ema(close, maFastLength)
maSlow = ema(close, maSlowLength)
diff   = maFast - maSlow

// === STOCHASTIC SETUP ===
k      = sma(stoch(close, high, low, StochLength), smoothK)
d      = sma(k, smoothD)

// Stochastic Long/Short Entry determination
stochLong  = crossover(k,d)  and (k < oversold)
stochShort = crossunder(k,d) and (k > overbought)

// Stochastic Long/Short Exit determination
stochLongEx  = crossover (k, overbought)
stochShortEx = crossunder(k, oversold)


// === PLOTTING EMAs ===
fast = plot(maFast, title = "Fast MA", color = yellow, linewidth = 1, style = line, transp = 10)
slow = plot(maSlow, title = "Slow MA", color = white,  linewidth = 1, style = line, transp = 10)


// === Vertical Coloring for Crosses in Overbought/Oversold zone and for MA Trend Zones ===
b_color = stochLong ? green : stochShort ? red : na
bgcolor(HighlightOBOS ? b_color : na, title="Overbought / Oversold", transp=65)   //Highlight the Overbought/Oversold Stoch Crossings
t_color = diff>=0 ? green : diff<0 ? red : na
bgcolor(HighlightTrend ? t_color : na, title="Trend up / Trend down", transp=75)  //Highlight the EMA Trend


// === STRATEGY LOGIC ===
// Time Restriction
timeInRange = true


// === STRATEGY - LONG POSITION EXECUTION ===
if stochLong and (diff >=0) and timeInRange    //Open Long when Stoch crossing in Oversold area and EMATrend is up
    strategy.entry(id = "Long", long = true)
if stochLong and (diff <0) and timeInRange     //Close Long when another Long Stoch cross signal is given after Trend has changed to down (avoid fake signals)
    strategy.close(id = "Long")
if stochLongEx and timeInRange                 //Close Long when Stoch is getting Overbought
    strategy.close(id = "Long")


// === STRATEGY - SHORT POSITION EXECUTION ===
if stochShort and (diff <0) and timeInRange and includeShorts  //Open Short when Stoch crossing in Overbought area and EMA Trend is down
    strategy.entry(id = "Short", long = false)
if stochShort and (diff >=0) and timeInRange                   //Close Short when another Short Stoch cross signal is given after Trend has changed to up (avoid fake signals)
    strategy.close(id = "Short")
if stochShortEx and timeInRange                                //Close Short when Stoch is getting Oversold
    strategy.close(id = "Short")


// === STRATEGY RISK MANAGEMENT EXECUTION ===
//Stop Loss
if useStopLoss    //Exit when Stop Loss is hit
    strategy.exit("Exit Long SL",   from_entry = "Long",  loss = close * StopLossPerc / syminfo.mintick )
    strategy.exit("Exit Short SL",  from_entry = "Short", loss = close * StopLossPerc / syminfo.mintick )

//Take Profit
if useTakeProfit  //Exit when Take Profit Limit is hit
    strategy.exit("Exit Long TP",   from_entry = "Long",  profit = close * TakeProfitPerc / syminfo.mintick)
    strategy.exit("Exit Short TP",  from_entry = "Short", profit = close * TakeProfitPerc / syminfo.mintick)