Trend Following Stop Loss Strategy Based on Trend Alert Indicator

Overview
The Trend Following Stop Loss strategy is a trend tracking stop loss trading strategy based on the TrendAlert indicator. It determines the trend direction through the TrendAlert indicator to implement trend tracking entry. At the same time, it uses the ATR indicator to set the stop loss to control risks.
Strategy Logic
The strategy consists of the following main parts:
-
The TrendAlert indicator judges the trend direction. When TrendAlert is greater than 0, it is a bullish signal. When less than 0, it is a bearish signal.
-
The ATR indicator calculates the price fluctuation range recently. ATR multiplied by the ATR stop loss multiplier atrStopMultiplier is used as the fixed stop loss.
-
The lowest low lowestLow and highest high highestHigh together with ATR stop loss construct the tracking stop loss. The structure parameter controls whether it is enabled.
-
Enter long or short positions according to the trend signal direction. After entering, set Take Profit and Stop Loss.
-
Close positions when price triggers stop loss or take profit.
The strategy filters false signals through trend judgment, controls risks through tracking stop loss, ensures profitability through take profit, and improves the stability of the trading system.
Advantage Analysis
The main advantages of this strategy are:
-
The dual guarantee of trend filtering and tracking stop loss avoids chasing market noise and ensures controllable trading risks.
-
ATR adaptive stop loss setting prevents over optimization and is suitable for various market environments.
-
Take profit ensures profitability and prevents eating up profits.
-
The strategy logic is clear and concise, easy to understand and modify, suitable for quantitative traders' secondary development.
-
Written in Pine Script language, can be used directly on the TradingView platform without programming skills.
Risk Analysis
There are also some risks in this strategy:
-
Incorrect trend judgment may cause unnecessary entry and stop loss trigger. You can appropriately relax the stop loss or filter entry signals.
-
When the market fluctuates violently, ATR may underestimate the true amplitude. At this time, the ATR stop loss multiplier atrStopMultiplier can be increased.
-
The target take profit may limit the profit space of the strategy. Adjust the limitMultiplier parameter according market.
-
The exist logic based only on price should be combined with time management.
Optimization Directions
The strategy can be optimized in the following aspects:
-
Optimize parameters ATR length atrLength and stop loss multiplier atrStopMultiplier to adjust the sensitivity of the stop loss algorithm.
-
Try different trend indicators to find better entry opportunities.
-
Select or adjust the target take profit parameter according to the characteristics of specific trading varieties.
-
Increase time stop loss mechanism to avoid overnight risks.
-
Filter false breakouts by combining trading volume indicators to improve strategy stability.
Conclusion
In general, this is a very practical trend tracking stop loss strategy. It uses indicators to determine the trend direction to achieve trend tracking, while setting adaptive stops to ensure risk control. The strategy logic is clear and easy to use, making it ideal for beginners to learn. At the same time, it also provides a good trading strategy framework for advanced strategy development, which is worth quantitative traders' in-depth research and optimization.
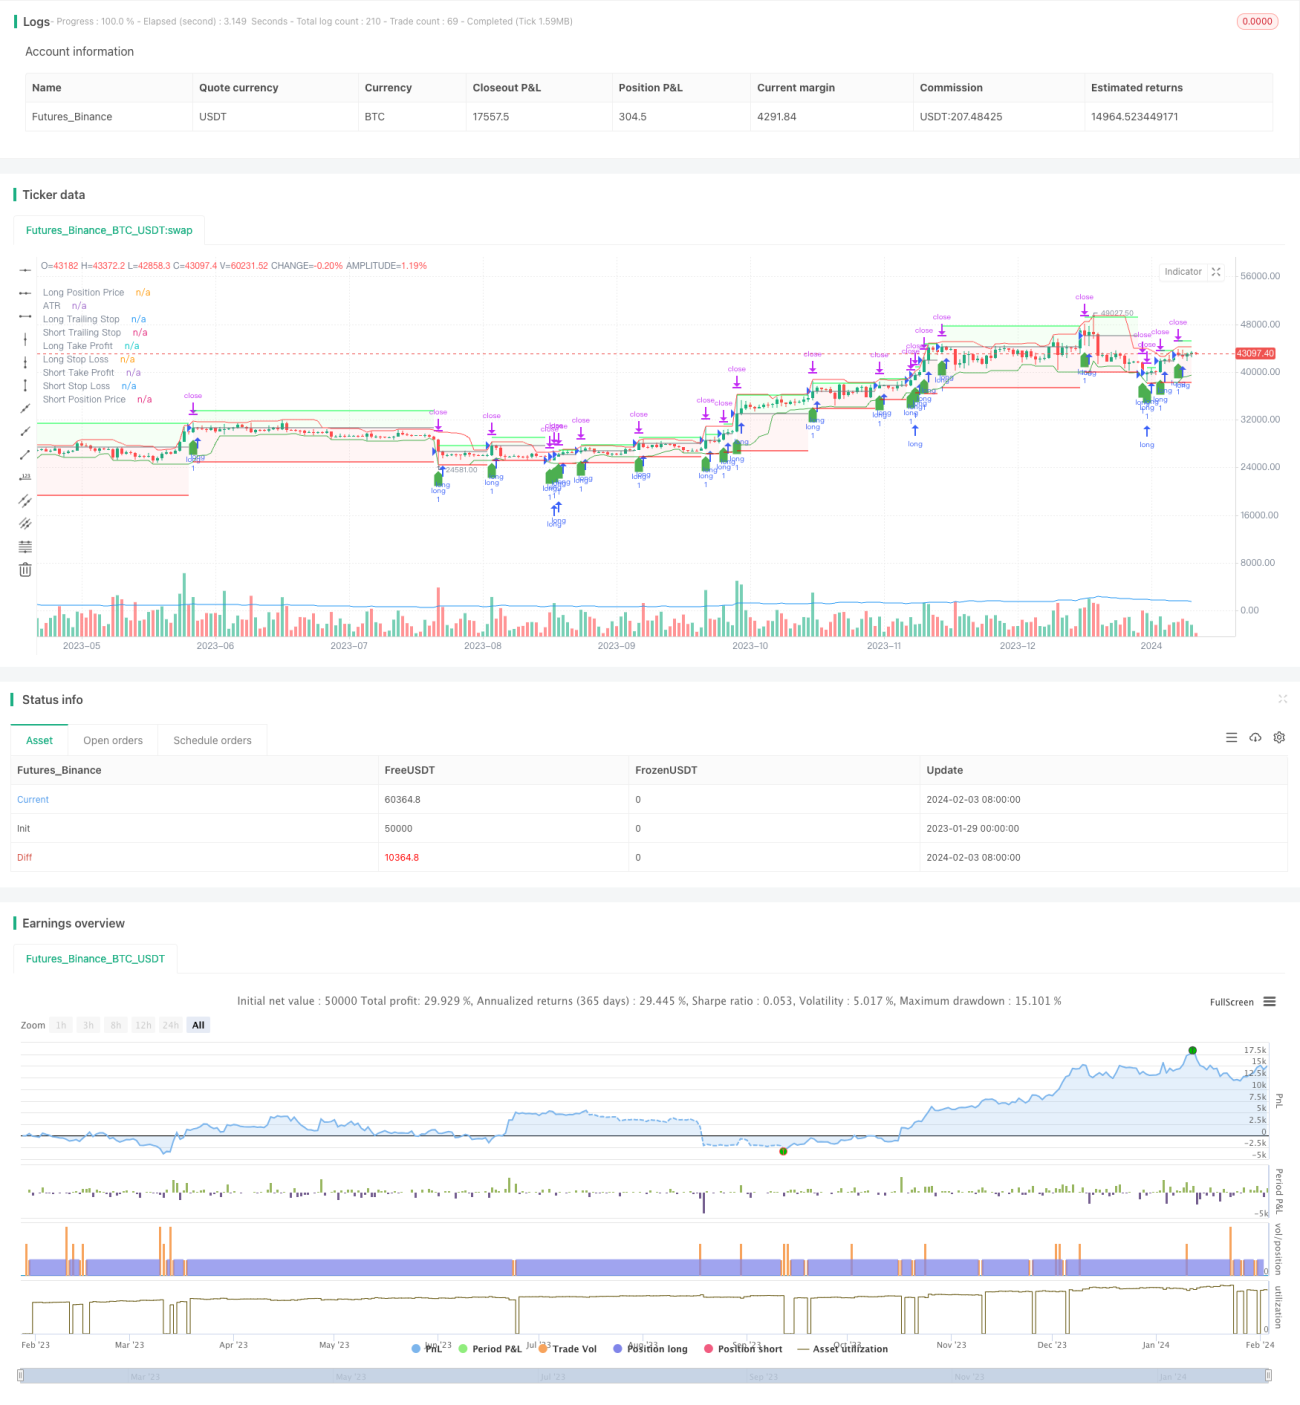
/*backtest
start: 2023-01-29 00:00:00
end: 2024-02-04 00:00:00
period: 1d
basePeriod: 1h
exchanges: [{"eid":"Futures_Binance","currency":"BTC_USDT"}]
*/

// This Pine Script™ code is subject to the terms of the Mozilla Public License 2.0 at https://mozilla.org/MPL/2.0/
// © jaque_verdatre

//@version=5- 1