Bollinger Band Strategy with Date Range Selection

Author: ChaoZhang, Date: 2024-02-05 16:04:40
Tags:

img

Overview

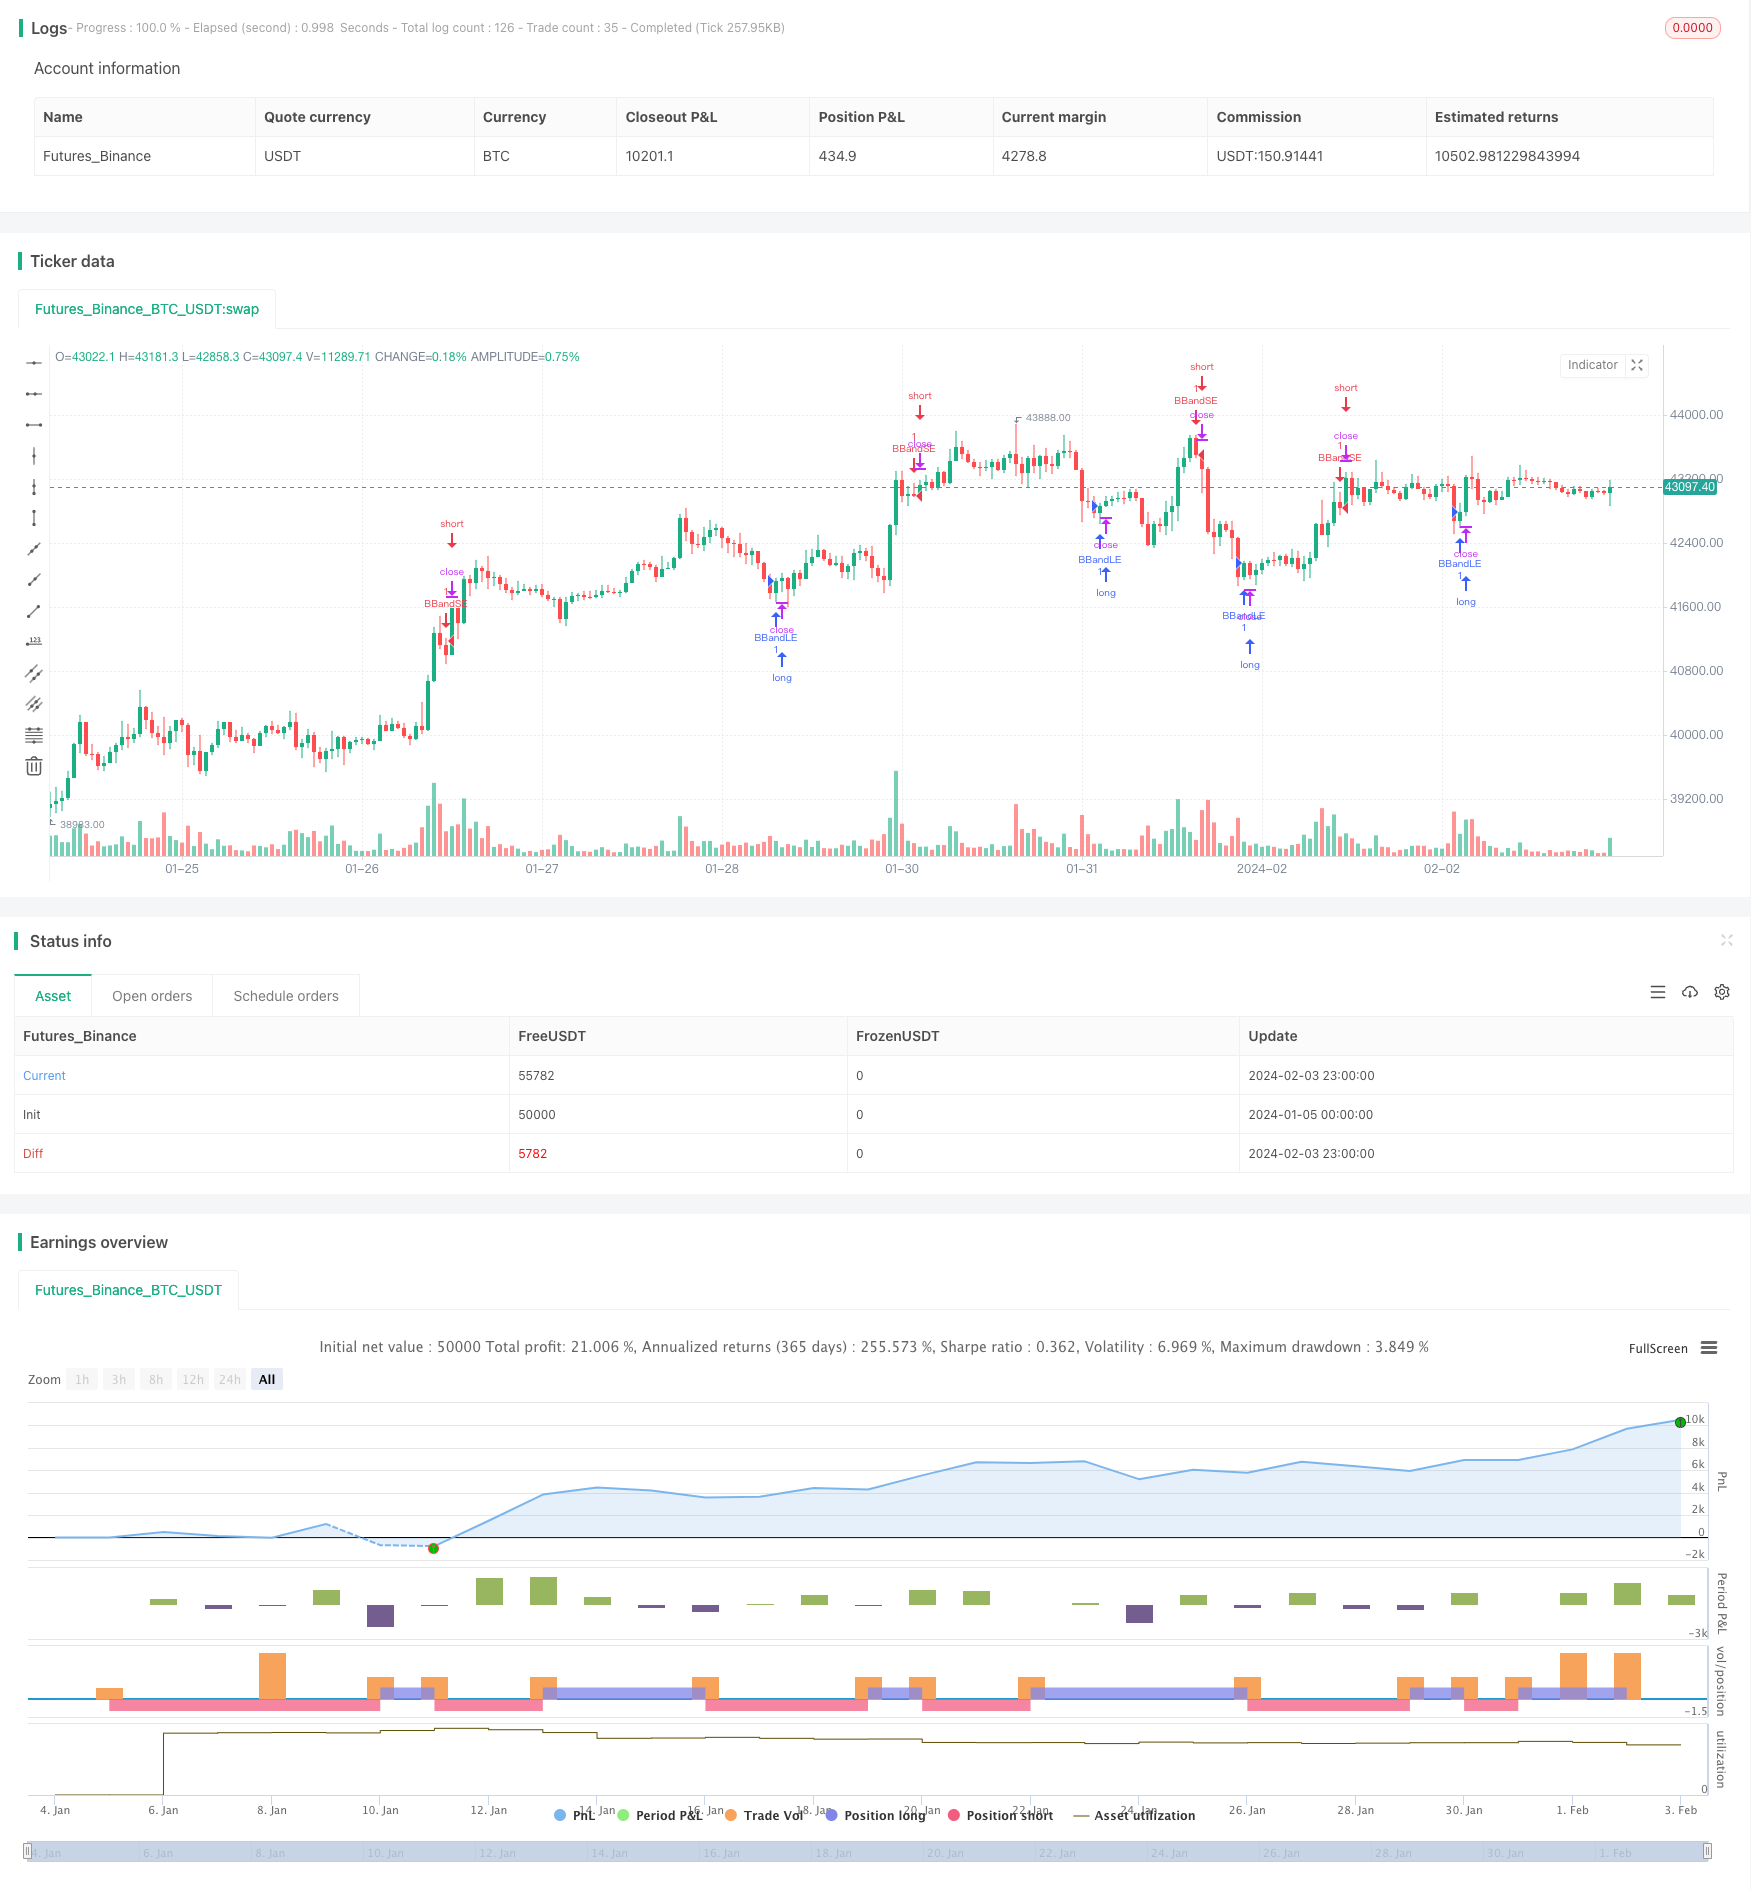
This strategy implements a dynamic Bollinger Band trading strategy with selectable historical date ranges based on the Bollinger Band indicator. It allows users to choose the start and end times for backtesting, thereby enabling backtesting and comparison of the dynamic Bollinger Band strategy in different time periods.

Strategy Name

The strategy is named “Bollinger Band Strategy with Date Range Selection”. The name contains the keywords “Bollinger Band” and “Date Range Selection”, accurately summarizing the main functions of this strategy.

Strategy Logic

The core principle of this strategy is to generate trading signals based on the dynamic upper and lower rails of the Bollinger Band indicator. The middle rail of the Bollinger Band is the n-day simple moving average, while the upper and lower rails are the middle rail plus and minus m times the n-day standard deviation respectively. When the price breaks through the lower rail, go long; when the price breaks the upper rail, go short.

Another core feature of this strategy is allowing users to select the backtesting time range. The strategy provides input parameters to select the start and end times for backtesting in multiple dimensions such as month, day, year, hour, minute, etc. This enables users to choose different historical time periods to backtest and validate the strategy, achieving more comprehensive and dynamic strategy analysis.

Specifically, this strategy converts the selected start and end times into timestamp format through the timestamp() function, and then sets the valid backtesting time window of the strategy through the conditions time>=start and time<=finish. This achieves the dynamic time range selection function.

Advantages

The biggest advantage of this strategy is that it perfectly combines the dynamic Bollinger Band strategy with arbitrary time range selection. This allows users to backtest and verify strategies in a more flexible and comprehensive manner. The specific advantages are:

  1. Implement dynamic Bollinger Band strategies that can capture trend reversal signals during market ups and downs for trend trading.

  2. Support choosing arbitrary historical time ranges for backtesting to analyze strategy performance in different market environments, achieving dynamic optimization of strategies.

  3. Combined with the adaptability of Bollinger Band indicators, this strategy can automatically adjust parameters to adapt to wider changes in market conditions.

  4. Provide adjustable parameters for long-term and short-term use so users can optimize parameters according to their own needs to make strategies more practical.

  5. Allow selection of specific hours and minutes for backtesting with higher accuracy for more detailed strategy analysis.

  6. Support Chinese and English languages for good user experience.

Risks

The main risks of this strategy lie in the uncertainty of the Bollinger Bands indicator in determining trend reversals. The specific risk points are:

  1. The Bollinger Bands indicator itself does not perfectly determine market fluctuations, and there may be false signals.

  2. Inappropriate selection of Bollinger Bands parameters can lead to poor strategy performance or even losses.

  3. Possibility of indicator failure in special market conditions.

  4. Improper selection of backtest date range may miss some important market conditions.

The following methods can be used to control and improve these risks:

  1. Optimize Bollinger Band parameters and adjust the cycle of the middle rail to adapt to different products and time periods.

  2. Use other indicators such as moving average for confirmation to reduce false signals.

  3. Test more market time periods to evaluate the robustness of the strategy.

  4. Set stop loss points to control single loss.

Directions for Strategy Optimization

There are several main directions to optimize this strategy:

  1. Combine machine learning algorithms to achieve dynamic optimization of Bollinger Band parameters.

  2. Increase functionality such as break-back testing to fully evaluate parameter stability.

  3. Add functions like moving stop loss and tracking stop loss to lock in profits and reduce risks.

  4. Optimize entry logic and set more confirming conditions such as surges in trading volumes.

  5. Combine strategies like stock index futures arbitrage to expand the scope of strategy application.

  6. Add auto trade execution functions for transitioning from backtesting to live trading.

These optimizations can greatly improve the practical performance and steady profitability of the strategy.

Summary

This strategy has successfully integrated the Bollinger Band strategy with arbitrary historical time range selection. Such highly flexible and dynamic backtesting analysis enables users to accurately adjust and optimize strategy parameters in different market environments. The provided visualization also greatly improves user experience. It is foreseeable that this strategy can provide users with powerful and efficient quantitative trading tools.


/*backtest
start: 2024-01-05 00:00:00
end: 2024-02-04 00:00:00
period: 1h
basePeriod: 15m
exchanges: [{"eid":"Futures_Binance","currency":"BTC_USDT"}]
*/

//@version=3

strategy("BB Range", shorttitle = "BB Range", overlay=true, max_bars_back=200)

// Revision:        1
// Author:          @allanster 

// === INPUT BACKTEST RANGE ===
FromMonth = input(defval = 7, title = "From Month", minval = 1, maxval = 12)
FromDay   = input(defval = 20, title = "From Day", minval = 1, maxval = 31)
FromYear  = input(defval = 2019, title = "From Year", minval = 2017)
FromHour  = input(defval = 17, title = "From Hour", minval = 00)
FromMinute  = input(defval = 00, title = "From Minute", minval = 00)

ToMonth   = input(defval = 1, title = "To Month", minval = 1, maxval = 12)
ToDay     = input(defval = 1, title = "To Day", minval = 1, maxval = 31)
ToYear    = input(defval = 9999, title = "To Year", minval = 2017)
ToHour  = input(defval = 23, title = "To Hour", minval = 00)
ToMinute  = input(defval = 59, title = "To Minute", minval = 00)

// === FUNCTION EXAMPLE ===
start     = timestamp(FromYear, FromMonth, FromDay, FromHour, FromMinute)  // backtest start window
finish    = timestamp(ToYear, ToMonth, ToDay, ToHour, ToMinute)        // backtest finish window
window()  => true
source = close
length = input(20, minval=1)
mult = input(2.0, minval=0.001, maxval=50)

basis = sma(source, length)
dev = mult * stdev(source, length)

upper = basis + dev
lower = basis - dev

upper_stop = upper * 1.05
lower_stop = lower * 0.95

buyEntry = crossover(source, lower)
sellEntry = crossunder(source, upper)

if (crossover(source, lower))
    strategy.entry("BBandLE", strategy.long, stop=lower_stop, when = window(), oca_name="BollingerBands",  comment="BBandLE")
else
    strategy.cancel(id="BBandLE")

if (crossunder(source, upper))
    strategy.entry("BBandSE", strategy.short, stop=upper_stop, when=window(), oca_name="BollingerBands",comment="BBandSE")
else
    strategy.cancel(id="BBandSE")


More