概述
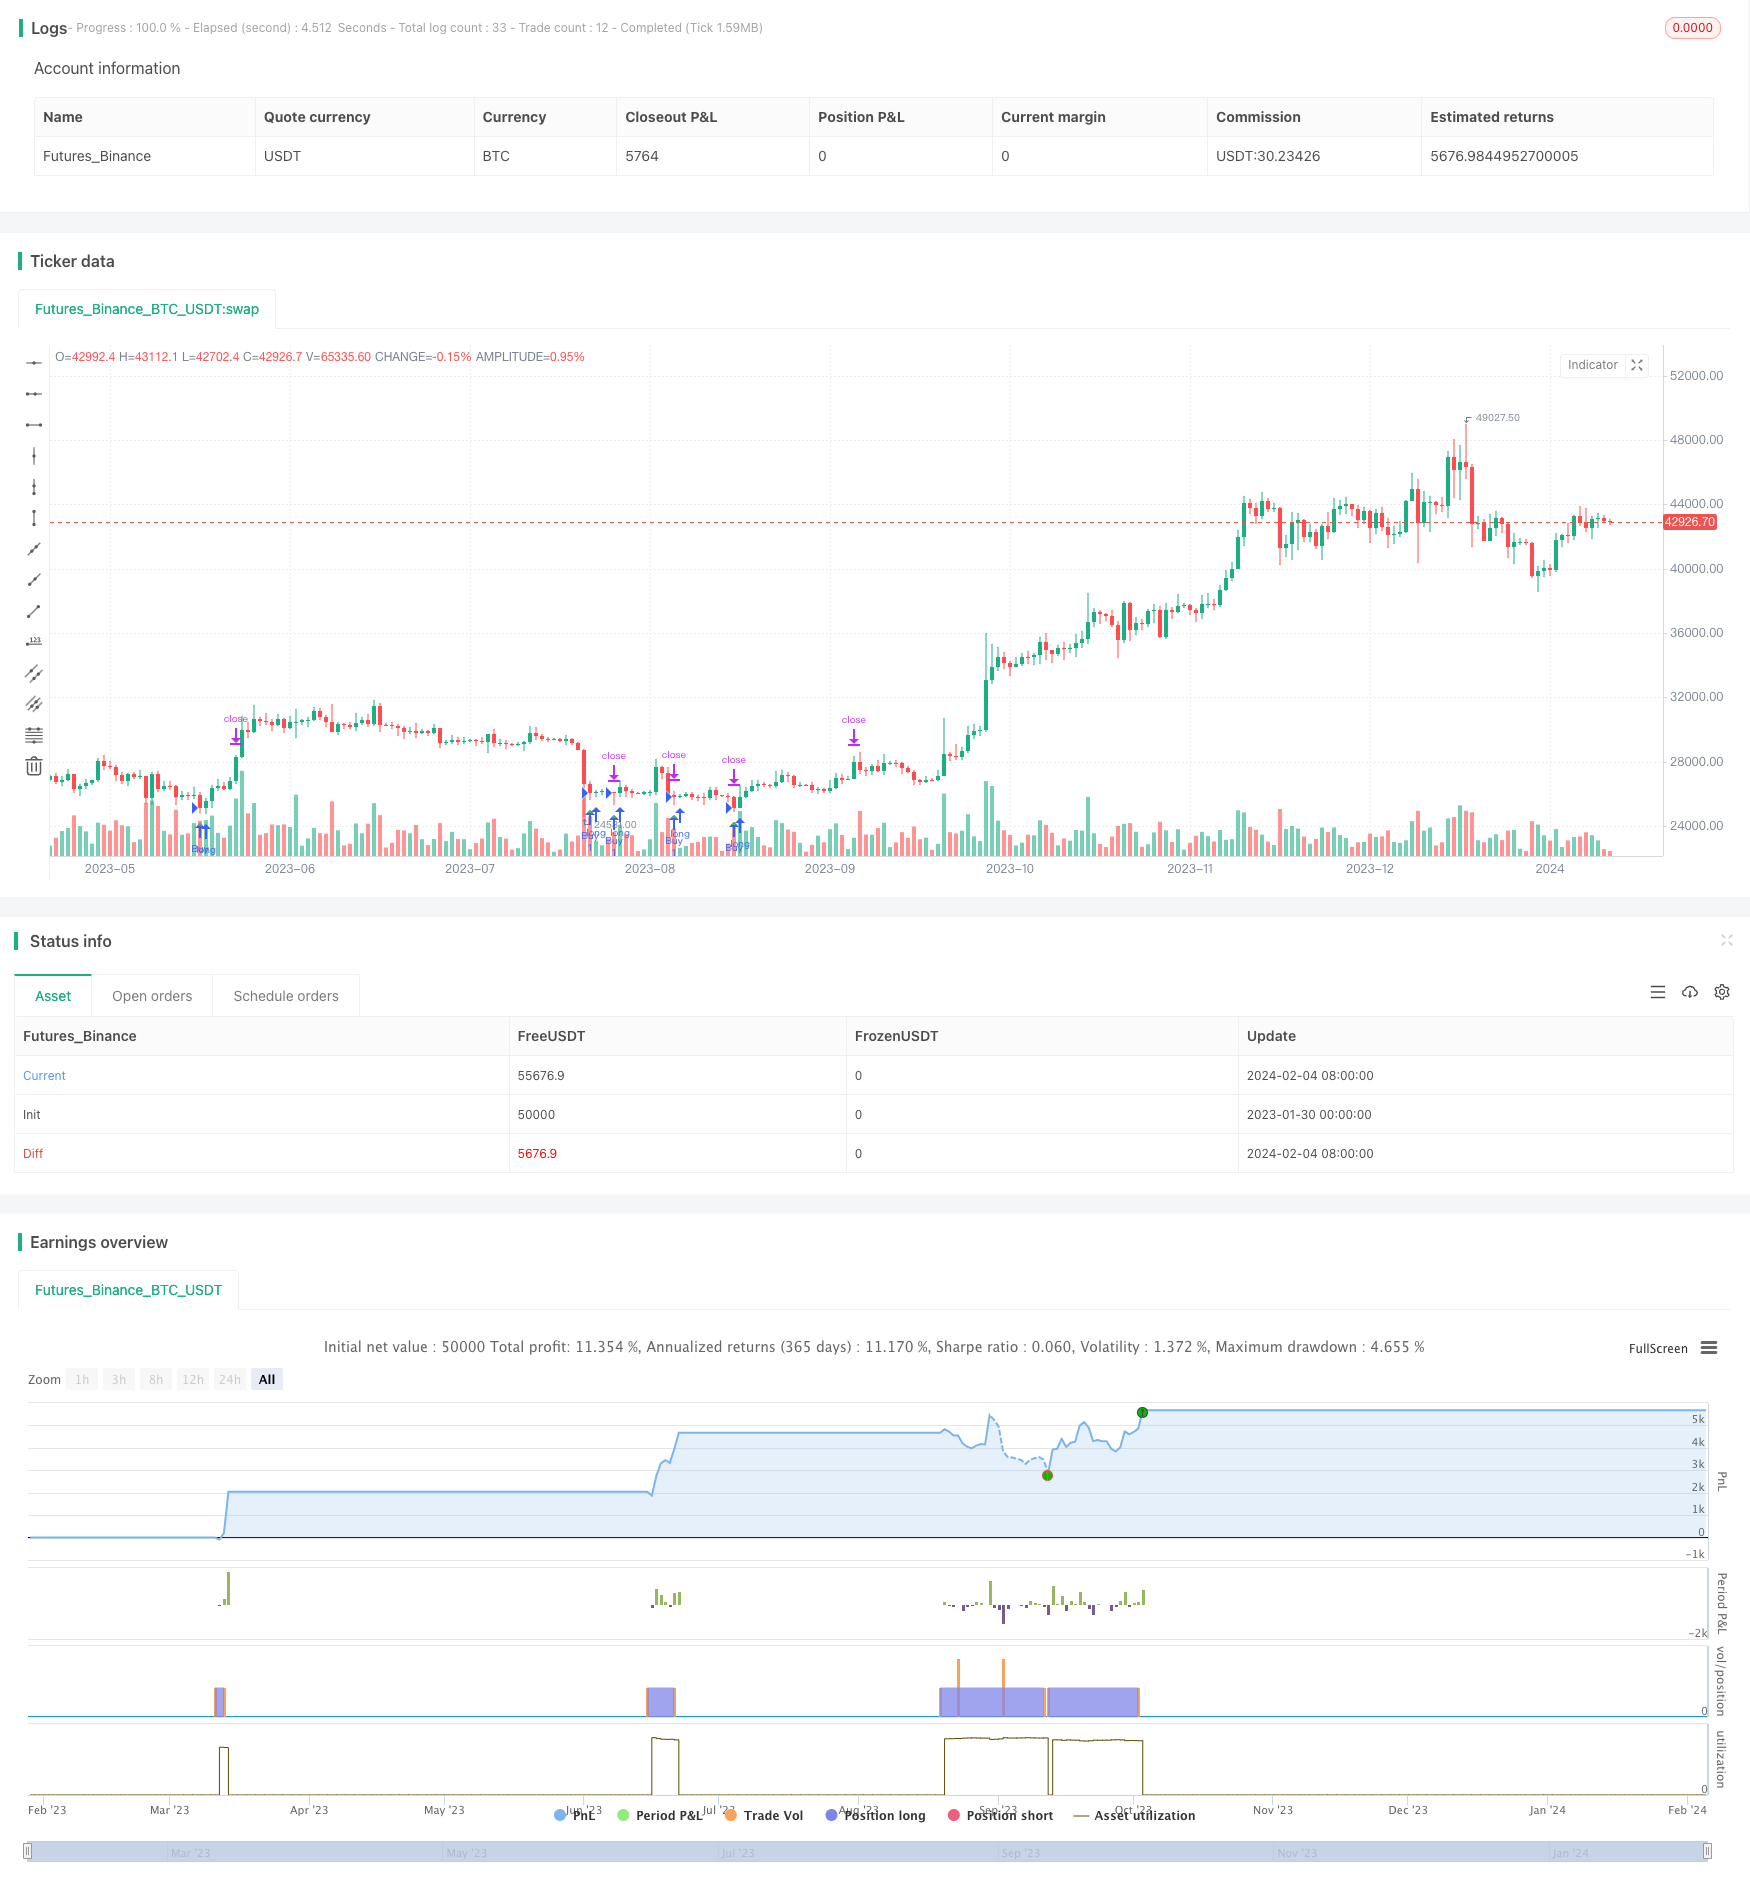
底部猎人策略是一种用于数字货币的短线交易策略。该策略通过识别下跌趋势中的底部,确定合适的买入时机。
策略原理
该策略结合多种技术指标来识别底部,具体来说,使用MACD指标判断底部反转信号,使用RSI指标判断超卖状态,使用布林带判断价格是否低于下轨。满足全部条件时产生买入信号。
首先,该策略使用MACD指标的故意发散来判断底部。所谓故意发散是指价格创新低而MACD指标没有创新低。这种情况代表着成交量的减弱,通常预示着即将出现的趋势反转。
其次,策略要求RSI指标低于31.1。RSI低于30代表着超卖状态,这为买入提供了机会。
最后,该策略要求收盘价低于布林带的中轨。这表示价格已经低于常态范围,从而也为买入提供了更好的机会。
当上述全部条件同时满足时,该策略产生买入信号,建立好仓。
优势分析
底部猎人策略具有以下优势:
- 使用多种指标判断底部,保证了底部识别的准确性
- 利用MACD指标的故意发散来判断反转信号,这是一种经验丰富的交易技巧
- 同时判断超卖和异动,避免了假突破的风险
- 仓位控制保守,只在关键点建仓,避免过度交易
风险分析
该策略也存在一些风险:
- 市场可能进一步下跌,无法及时止损
- 多重条件组合判断底部,在些场景下可能因此错过底部
- 需要人工确定参数,如RSI的阈值,这可能影响策略表现
针对上述风险,可以通过实时跟踪止损,调整参数区间等方式进行优化。
优化方向
该策略可以从以下几个方向进行优化:
- 增加自适应止损机制,根据市场波动程度来灵活调整止损位置
- 对买入信号的判断条件进行测试与优化,确定最佳参数
- 增加机器学习算法,自动识别参数及交易规则
- 增加趋势判断模块,避免在趋势市场中误入震荡市
- 结合交易量变化等指标,提高对底部的判断能力
总结
底部猎人策略通过捕捉关键底部来进行买入,以期获得超额利润。该策略判断底部的依据稳健,同时结合多种过滤条件来避免假信号。如果参数调整得当、止损控制到位,该策略可以在数字货币市场的短线交易中获得不错的效果。
策略源码
/*backtest
start: 2023-01-30 00:00:00
end: 2024-02-05 00:00:00
period: 1d
basePeriod: 1h
exchanges: [{"eid":"Futures_Binance","currency":"BTC_USDT"}]
*/

//@version=5
strategy("MACD Divergence Strategy", shorttitle="Strategy: MACD Dive", overlay=true)

// MACD设置
fastLength = input.int(12, "Fast Length")
slowLength = input.int(26, "Slow Length")
signalSmoothing = input.int(9, "Signal Smoothing")

[macdLine, signalLine, _] = ta.macd(close, fastLength, slowLength, signalSmoothing)

// 计算99日EMA均线
ema99 = ta.ema(close, 99)

// 计算RSI
rsiLength = input.int(14, title="RSI Length")
rsi = ta.rsi(close, rsiLength)

// 计算布林带中轨
length = input.int(20, "BB Length")
src = input(close, "Source")
mult = input.float(2.0, "BB StdDev")
basis = ta.sma(src, length)

// 买入筛选条件
priceLow = ta.lowest(low[1], 60)
macdLow = ta.lowest(macdLine[1], 60)
divergence = low < priceLow and macdLine > macdLow

allHighsBelowEma99 = true
for i = 0 to 14
    if high[i] > ema99
        allHighsBelowEma99 := false

rsiBelow = rsi < 31.1
priceDifference = (high - low) / low * 100

buySignal1 = divergence and allHighsBelowEma99 and rsiBelow
buySignal2 = high < ema99 and priceDifference >= 3 and close < open and high < basis
buySignal3 = buySignal1 or buySignal2

// 定义一个变量来存储买入时的价格
var float buyPrice = na

// 买入逻辑
if buySignal3
    buyPrice := close // 存储买入时的价格
    strategy.entry("Buy", strategy.long)

// 止盈和止损条件
longTakeProfit = buyPrice * 1.1 // 止盈设为买入价格的1.2倍
longStopLoss = buyPrice * 0.98// 止损设为买入价格的0.99倍

// 应用止盈和止损
strategy.exit("Exit", "Buy", limit=longTakeProfit, stop=longStopLoss)
// 绘制买入信号
plotshape(series=buySignal3, title="Buy Signal", location=location.belowbar, color=color.green, style=shape.triangleup, size=size.small)