Price Channel and Moving Average Based Trend Following Strategy

1
Follow
1782
Followers
Overview
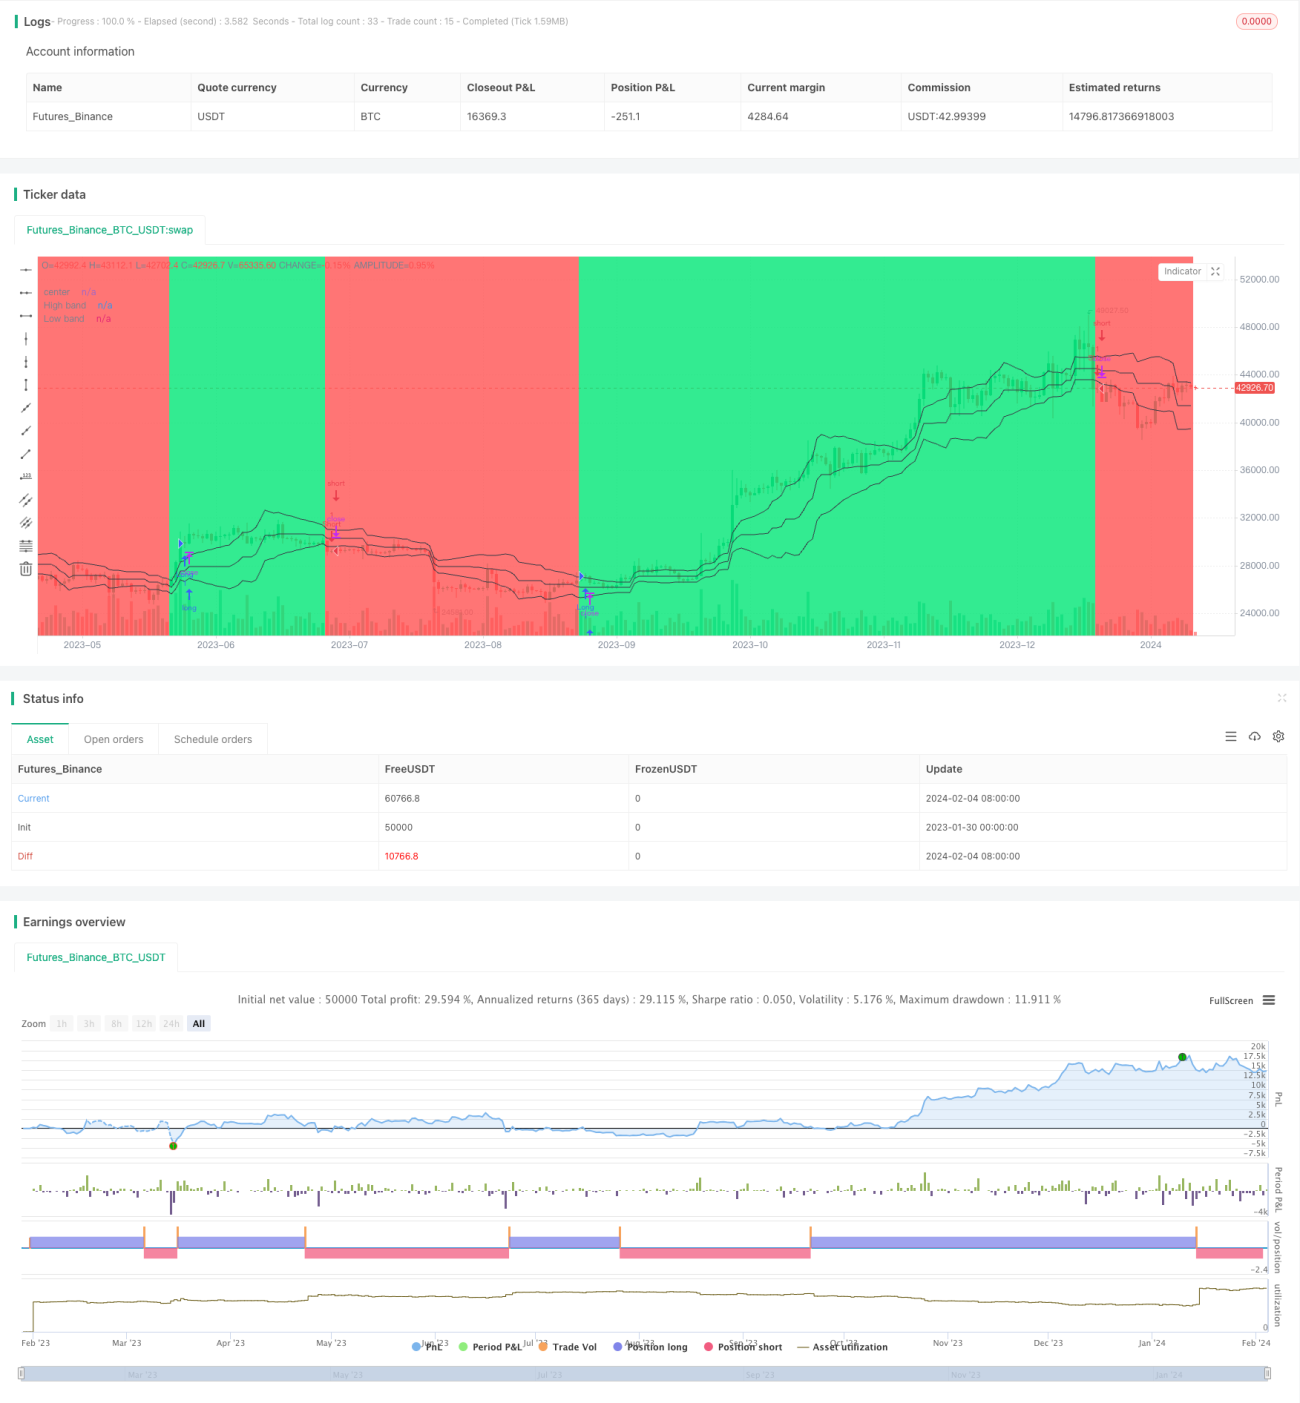
This strategy identifies and follows trends by constructing a Price Channel to calculate the deviation of price from the middle line and using moving averages to filter signals. Trading signals are generated when price breaks through the Channel. The strategy has both trend following and breakout characteristics.
Strategy Logic
- Build Price Channel
- Calculate highest high and lowest low over the past len periods
- Middle line is average of highest high and lowest low
- Distance is absolute deviation of price from middle line
- Smooth distance to get upper and lower bands
- Determine Trend Direction
- When price is below lower band, define as downtrend
- When price is above upper band, define as uptrend
- Generate Trading Signals
- In uptrend, long when price is below open or breaks below upper band
- In downtrend, short when price is above open or breaks above lower band
Advantage Analysis
- Captures mid- to long-term trends
- Combines with breakout signals to avoid ineffective trading in range-bound markets
- Customizable parameters suit different products
Risk Analysis
- More minor losses possible in oscillating trends
- Inappropriate parameter settings may miss trend reversals
- Monitor trade frequency to prevent overtrading
Optimization Directions
- Add other indicators to filter signals
- Dynamically adjust Price Channel parameters
- Incorporate stop loss to optimize risk management
Conclusion
The strategy is overall quite robust in tracking mid- to long-term trends effectively while generating trading signals through trend breakouts. Further improvements can be made through parameter optimization and signal filtering to adapt the strategy to more products and market environments.
Source
Pine
Strategy parameters
Related strategies
Comment
All comments (0)
No data
- 1