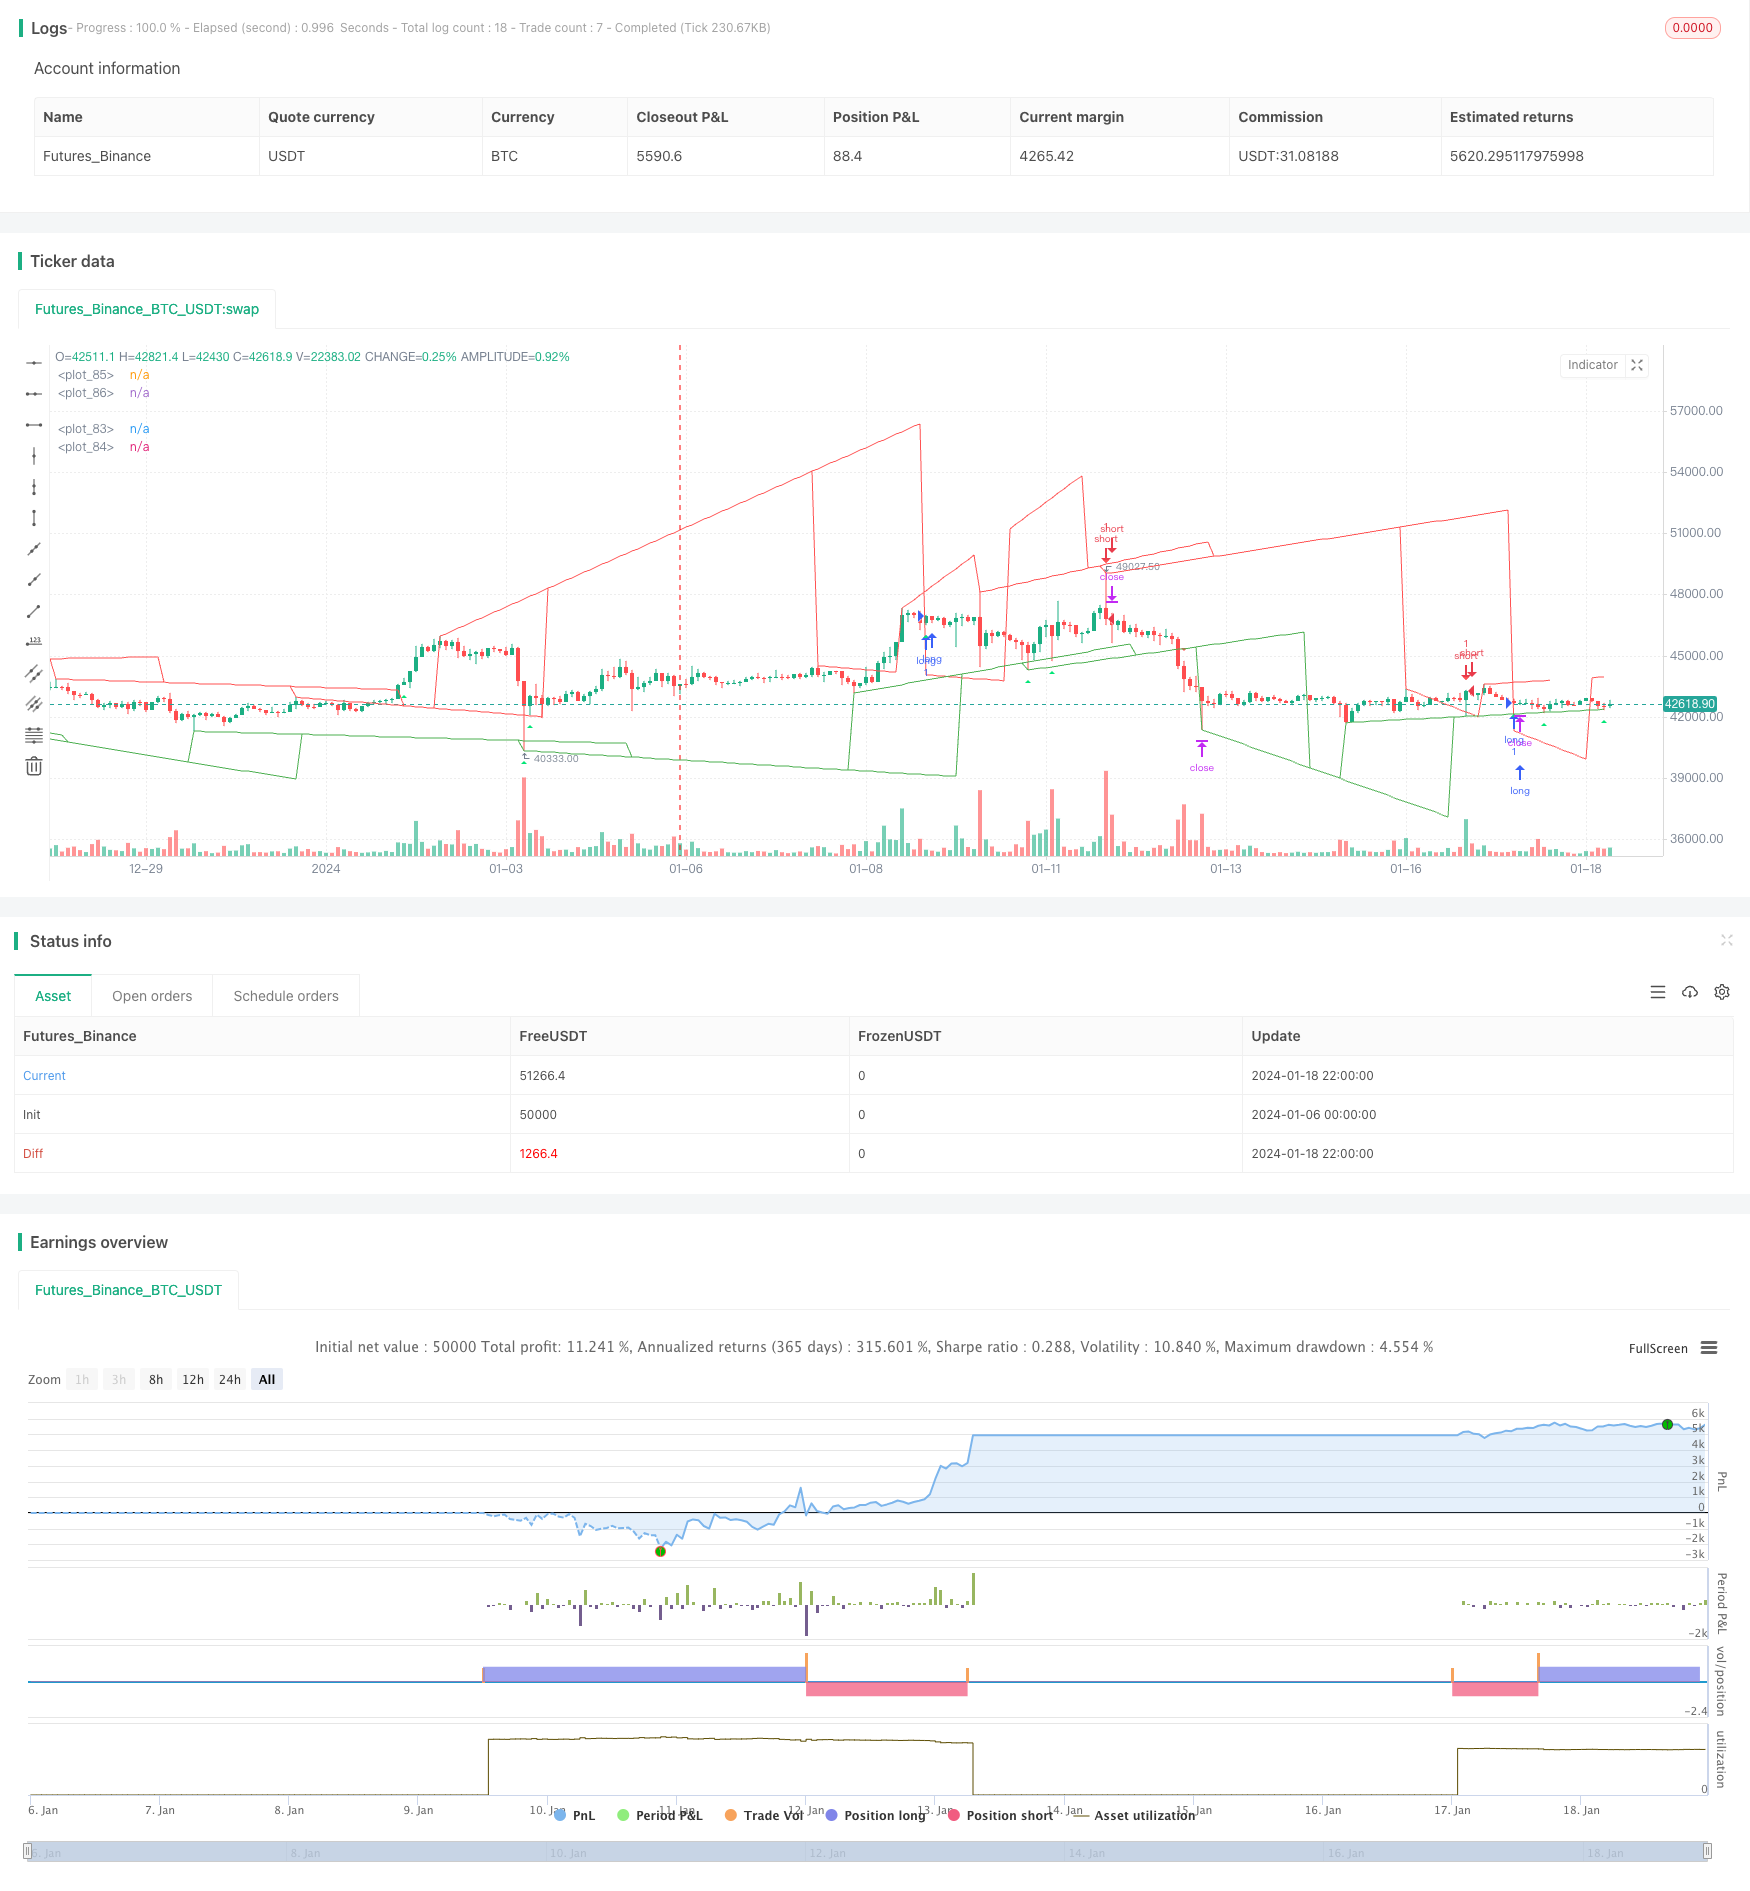
概述
本策略的核心思想是利用动态斜率判断价格趋势方向,结合突破判断进行交易信号产生。具体来说,它会实时跟踪价格新高点和新低点,根据不同时间段内价格变化计算动态斜率,再结合价格对趋势线的突破情况判断多空信号。
策略原理
本策略主要分为以下几个步骤:
判断最高价和最低价:跟踪一定周期(如20根K线)内的最高价和最低价,判断是否创新高或新低
计算动态斜率:记录创新高或新低的K线编号,计算从创新高低点到一定周期(如9根K线)后的高低点的动态斜率
绘制趋势线:根据动态斜率,绘制上升和下降的趋势线
延长和更新趋势线:当价格突破趋势线时,会延长和更新趋势线
交易信号:结合价格对趋势线的突破,判断做多和做空信号
策略优势
本策略具有以下优势:
动态判断趋势方向,灵活应对市场变化
能够合理控制止损,回撤小
突破交易信号清晰,实现简单
可自定义参数,适应性强
代码结构清晰,易于理解和二次开发
风险及解决方案
本策略也存在一些风险:
趋势震荡时多头空,建议加入过滤条件
突破假信号可能较多,可适当调整参数或加入过滤条件
行情剧烈变动时止损风险,可加大止损幅度
优化空间有限,盈利能力受限,适合短线交易
优化方向
本策略可优化的地方包括:
加入更多技术指标判断过滤信号
优化参数组合,寻找最佳参数
尝试改进止损策略,降低风险
增加自动调整入场幅度的功能
尝试与其他策略组合,发掘更多机会
总结
本策略整体来说是一个基于动态斜率判断趋势并突破交易的高效短线策略。它判断准确,风险可控,适合用来捕捉市场中的短线机会。通过进一步优化参数和加入过滤条件,可以使策略的胜率和盈利水平得到提高。
策略源码
/*backtest
start: 2024-01-06 00:00:00
end: 2024-01-19 00:00:00
period: 2h
basePeriod: 15m
exchanges: [{"eid":"Futures_Binance","currency":"BTC_USDT"}]
*/

// This source code is subject to the terms of the Mozilla Public License 2.0 at https://mozilla.org/MPL/2.0/
// © pune3tghai

//Originally posted by matsu_bitmex

//tried adding alerts on plots and cleared the chart for a cleaner view.
//Publishing the script in hope of getting it improved by someone else.

//Added strategy code for easier calculations

//Needs work on TP and SL part.

//P.S - THE ORIGINAL CODE IS MUCH BETTER BUT I have tried to be more usable and understandable.

//@version=4
strategy("TrendLines with Alerts", overlay=true)     //study("TrendLines with Alerts", overlay=true)
//update

length1 = input(20)
check = input(9)
//length2 = input(200)


u=0.0
u := u[1]

l=0.0
l := l[1]

y=0.0
y := y[1]

yl=0.0
yl := yl[1]

angle = 0.0
angle := angle[1]

anglel = 0.0
anglel := anglel[1]

if (highest(length1) == high[check] and highest(length1) == highest(length1)[check] and barssince(barstate.isfirst) > check)
    u := high[check]


if (lowest(length1) == low[check] and lowest(length1) == lowest(length1)[check] and barssince(barstate.isfirst) > check)
    l := low[check]


p = round(barssince(u == high[check]))

pl = round(barssince(l == low[check]))

if p == 0 and barssince(barstate.isfirst) > check
    y := high[abs(p[1]+1+check)]

if pl == 0 and barssince(barstate.isfirst) > check
    yl := low[abs(pl[1]+1+check)]


if p == 0
    angle := (u-y)/p[1]

if pl == 0
    anglel := (l-yl)/pl[1]

uppertrend = u+ (p * angle)

lowertrend = l+ (pl * anglel)

extendup = if barssince(barstate.isfirst) > check
    uppertrend[check] + angle[check] * check*2

extenddown = if barssince(barstate.isfirst) > check
    lowertrend[check] + anglel[check] * check*2


//plot(l[offset]-u,color=red)
//plot(u[offset]-l,color = green )
plot(lowertrend, color = color.green, transp=30,offset = -check)
plot(extenddown, color = color.green, transp=100)
plot(uppertrend, color = color.red, transp=30, offset = -check)
plot(extendup, color = color.red, transp=100)
//plot(l[offset], color = red)

l1 = lowertrend
l2 = extenddown
u1 = uppertrend
u2 = extendup


l2sell = crossunder(high, l2)
u2buy = crossover(low, u2)
buy1 = (low<=lowertrend) and open>lowertrend and high>lowertrend and close>lowertrend
buy2 = (low<=extenddown) and open>extenddown and high>extenddown and close>extenddown
buy = buy1 or buy2 or u2buy
plotshape(series=buy, title="Buy", style=shape.triangleup, size=size.tiny, color=color.lime, location=location.belowbar)
sell1 = (high>=uppertrend) and open<uppertrend and low<uppertrend and close<uppertrend
sell2 = (high>=extendup) and open<extendup and low<extendup and close<extendup
sell = sell1 or sell2 or l2sell
plotshape(series=sell, title="Sell", style=shape.triangledown, size=size.tiny, color=color.red, location=location.abovebar)

longCond = buy
shortCond = sell

tp = input(0.2, title="Take Profit")

tpbuyval = valuewhen(buy, close, 1) + (tp/100)*(valuewhen(buy, close, 1))
tpsellval = valuewhen(sell, close, 1) - (tp/100)*(valuewhen(sell, close, 1))


sl = input(0.2, title="Stop Loss")
slbuyval = valuewhen(buy, close, 0) - (sl/100)*(valuewhen(buy, close, 0))
slsellval = valuewhen(sell, close, 0) + (sl/100)*(valuewhen(sell, close, 0))
// === STRATEGY ===
tradeType = input("BOTH", title="What trades should be taken : ", options=["LONG", "SHORT", "BOTH", "NONE"])

// stop loss
slPoints = input(defval=0, title="Initial Stop Loss Points (zero to disable)", minval=0)
tpPoints = input(defval=0, title="Initial Target Profit Points (zero for disable)", minval=0)

//>>>>>>>>>>>>>>>>>>>>>>>>>>>>>>>>>>>>>>>>>>>>>>>>>>>>>>>>>>>>>>>>>>>>>>>>>>>>>//

testStartYear = input(2019, "Backtest Start Year", minval=1980)
testStartMonth = input(1, "Backtest Start Month", minval=1, maxval=12)
testStartDay = input(1, "Backtest Start Day", minval=1, maxval=31)
testPeriodStart = timestamp(testStartYear, testStartMonth, testStartDay, 0, 0)

testStopYear = input(9999, "Backtest Stop Year", minval=1980)
testStopMonth = input(12, "Backtest Stop Month", minval=1, maxval=12)
testStopDay = input(31, "Backtest Stop Day", minval=1, maxval=31)
testPeriodStop = timestamp(testStopYear, testStopMonth, testStopDay, 0, 0)

testPeriod() =>
    time >= testPeriodStart and time <= testPeriodStop ? true : false

//<<<<<<<<<<<<<<<<<<<<<<<<<<<<<<<<<<<<<<<<<<<<<<<<<<<<<<<<<<<<<<<<<<<<<<<<<<<<<//

//
//set up exit parameters
TP = tpPoints > 0 ? tpPoints : na
SL = slPoints > 0 ? slPoints : na

// Make sure we are within the bar range, Set up entries and exit conditions
if testPeriod() and tradeType != "NONE"
    strategy.entry("long", strategy.long, when=longCond == true and tradeType != "SHORT")
    strategy.entry("short", strategy.short, when=shortCond == true and tradeType != "LONG")
    strategy.close("long", when=shortCond == true and tradeType == "LONG")
    strategy.close("short", when=longCond == true and tradeType == "SHORT")
    strategy.exit("XL", from_entry="long", profit=tpbuyval, loss=slbuyval)
    strategy.exit("XS", from_entry="short", profit=tpsellval, loss=slsellval)

// === /STRATEGY ===
//EOF


////ALERT SYNTEX
//alertcondition(longCond, title="Long", message="Killer Market")
//alertcondition(shortCond, title="Short", message="Poopy Market")