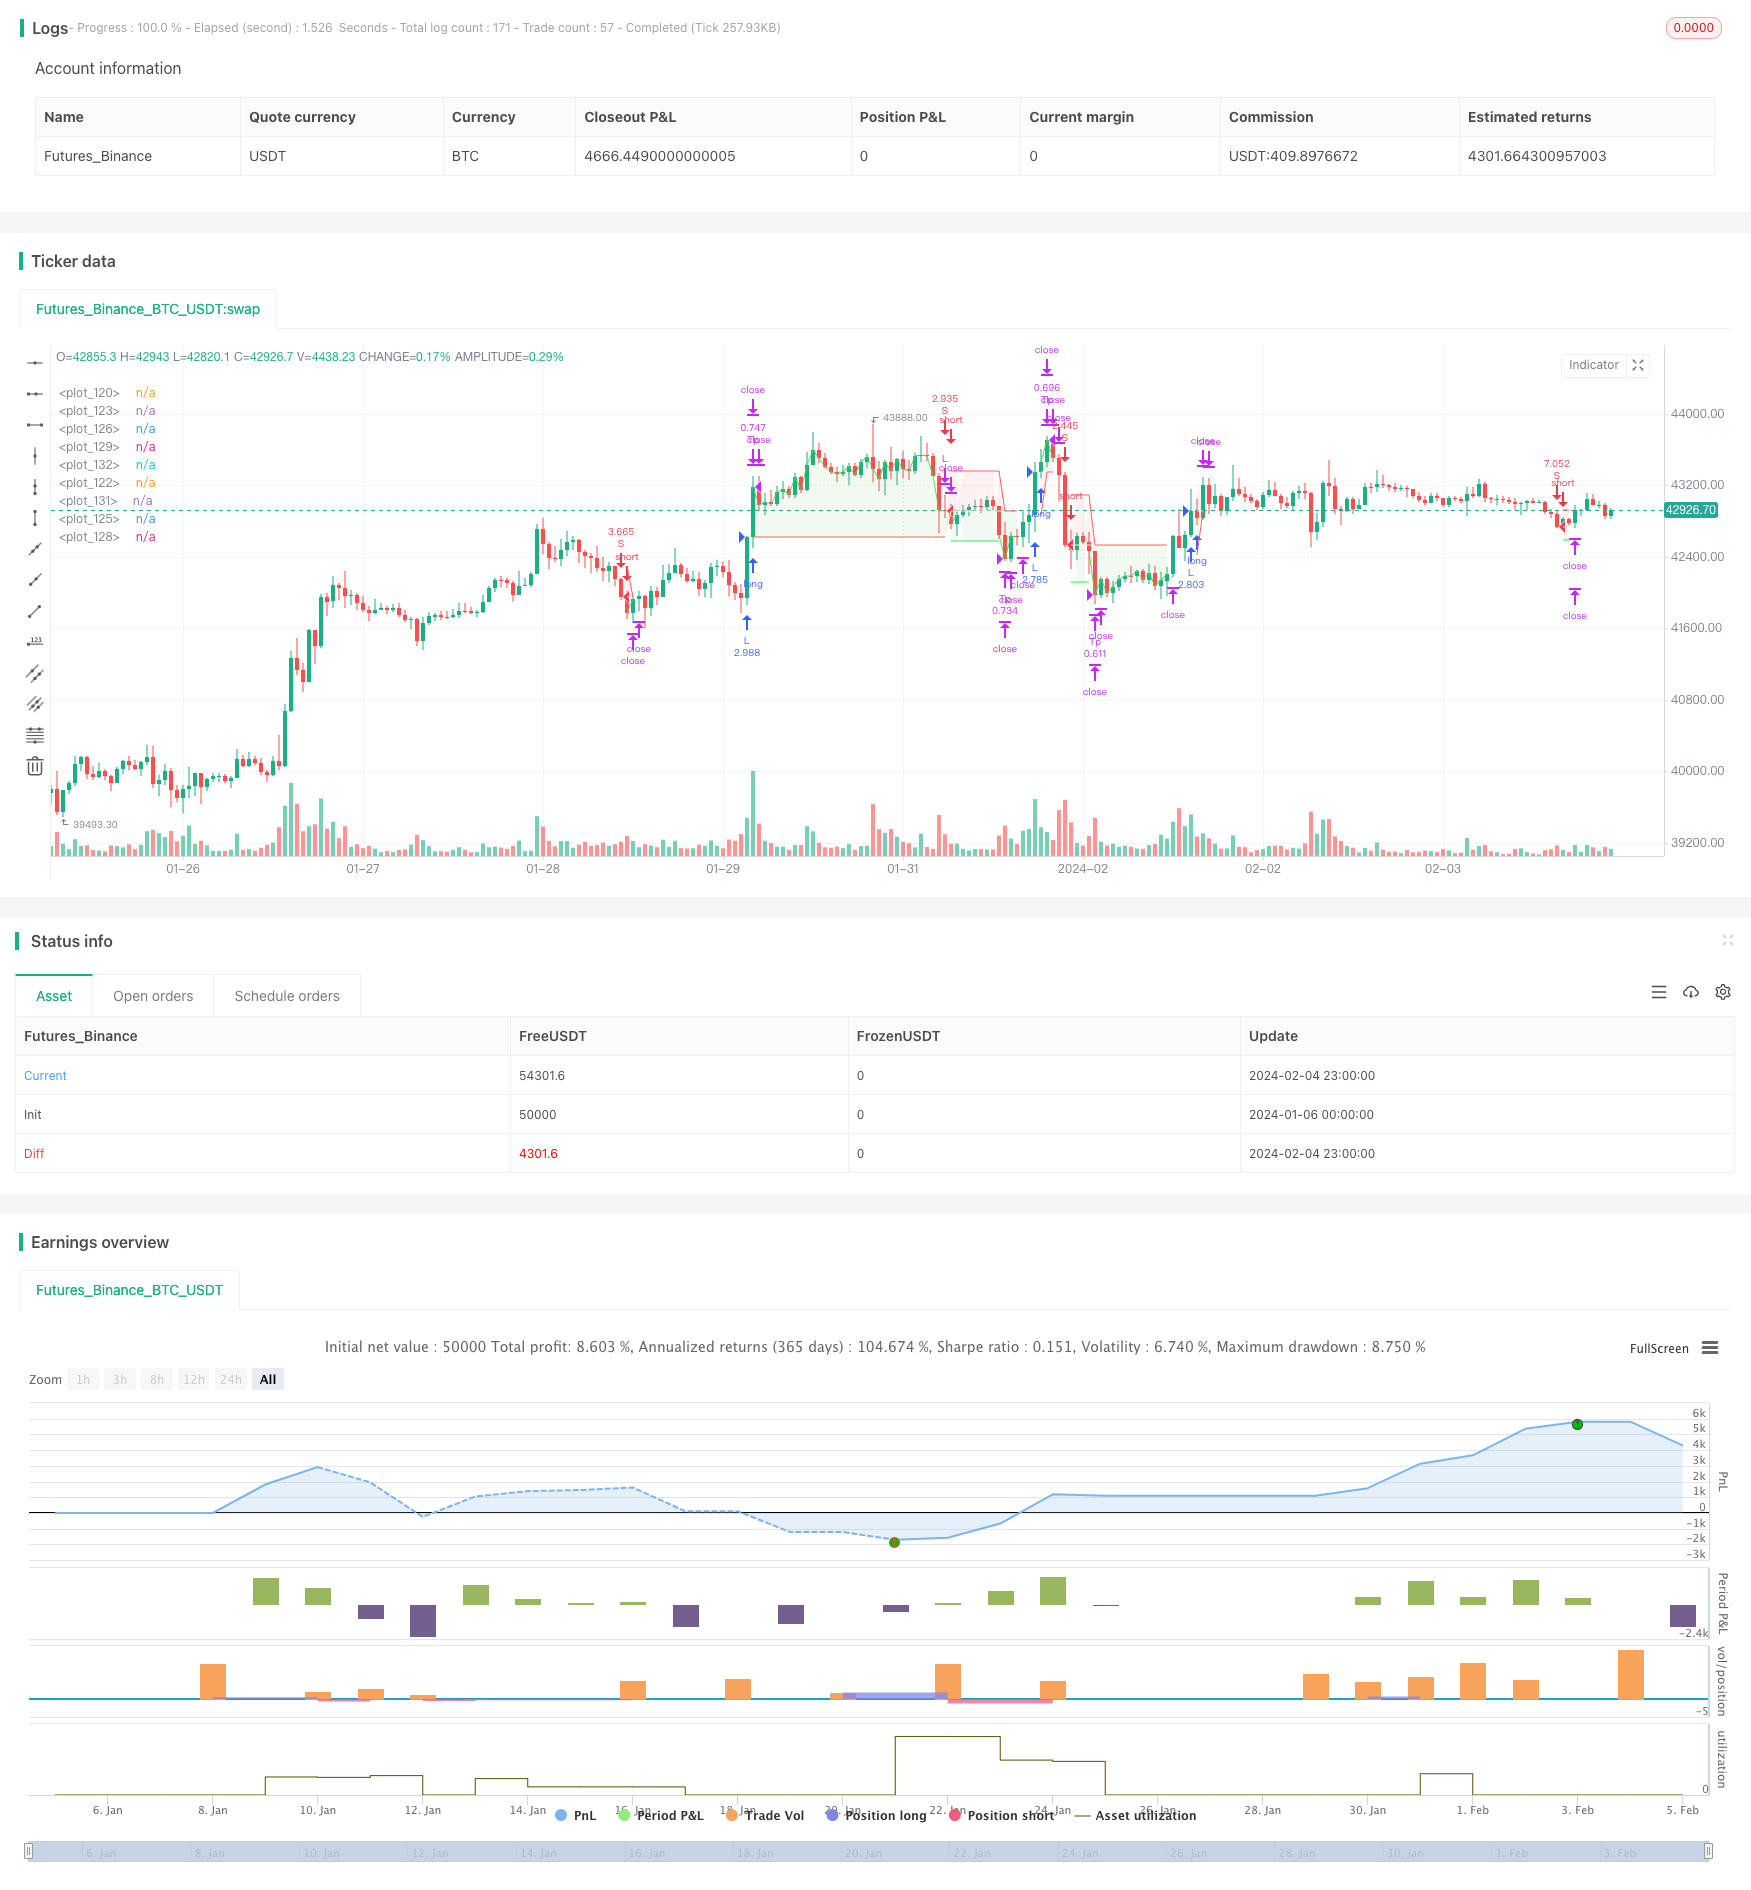
概述
本策略是一个基于超级趋势指标的比特币自动量化交易策略。它采用超级趋势指标判断市场趋势,结合ATR止损原理控制风险,实现长短双向交易。该策略最大优势是风险和收益比良好,止损策略可靠,适合中长期持有。本策略可在Coinbase Pro等主流交易所4小时级别上运用。
策略原理
本策略使用超级趋势指标判断市场趋势方向。当超级趋势指标转换从下降趋势变为上升趋势时,做多头入场;当超级趋势指标转换从上升趋势变为下降趋势时,做空头入场。
具体来说,本策略首先计算ATR指标的长度为14周期,通过乘于一个ATR止损倍数(如1.5倍)来确定每单的止损距离。之后计算超级趋势指标,指标参数采用默认值(ATR周期9,超级趋势系数2.5)。当超级趋势指标转换方向时发出交易信号。
入场后,止损位固定在ATR止损上方或下方。首个止盈位根据风险回报比例计算,默认为0.75,即止盈距离是止损距离的0.75倍。当价格达到第一个止盈位时,平仓50%头寸,并把止损移至开仓价格(获利后加仓),使该头寸实现盈利锁定。第二个止盈距离继续按0.75风险回报比例计算。如果价格触发止损,则剩余全部头寸止损出场。
这样,本策略可以在保证止损风险可控的前提下,通过部分止盈确保盈利,适合中长线持有投资策略。
优势分析
本策略最大优势是风险收益比良好,可以中长期持有。具体优势有:
采用超级趋势判断市场趋势,过滤市场噪音,避免错过主要趋势。
ATR动态跟踪止损,可靠控制单笔损失。
部分止盈方式锁定盈利,风险收益比高。
当价格达到止盈1后调整止损到开仓价,确保盈利,增强策略稳定性。
超级简单的交易逻辑,容易理解实现,参数调优空间大。
可在主流交易所的日内或高频数据上应用,灵活性强。
风险分析
本策略也存在一定风险,主要集中在以下几个方面:
市场突发事件造成gaps或跳空,无法止损,面临较大亏损。可通过合理调整ATR止损倍数来降低风险。
超级趋势指标判断失败,造成交易信号错误。可适当调整ATR和超级趋势参数组合进行优化。
部分平仓比例设置过高,无法获得足够趋势获利。应根据不同市场调整部分平仓比例。
交易频率可能过高或过低。应调整超级趋势参数,找到最佳平衡。
优化方向
本策略可优化的空间还很大,主要集中在以下几个方面:
尝试不同的ATR止损方式,如标准ATR、动量止损、布林带止损等方式优化止损策略。
测试不同参数的超级趋势指标,找到最优参数组合。可使用步进优化或遗传算法进行多维参数优化。
尝试在止损上叠加第二层止损指标,如Donchian通道,使止损更加可靠。
测试不同的部分平仓比例,找到最优的盈利兑现和风险平衡。部分平仓比例也可动态调整。
探索基于机器学习的动态止损、动态位置调整等策略。
总结
本策略是一个基于超级趋势判断趋势,ATR动态止损,部分止盈获利的量化策略。它风险收益平衡良好,适合自动化交易。该策略可大幅优化超参、止损方式、盈利方式等,是值得长期调优和运用的量化策略。
/*backtest
start: 2024-01-06 00:00:00
end: 2024-02-05 00:00:00
period: 1h
basePeriod: 15m
exchanges: [{"eid":"Futures_Binance","currency":"BTC_USDT"}]
*/

// This source code is subject to the terms of the Mozilla Public License 2.0 at https://mozilla.org/MPL/2.0/
// Developed by © StrategiesForEveryone
//@version=5

strategy("SuperTrend Strategy for BTCUSD 4H", overlay=true, process_orders_on_close = true, initial_capital = 100, default_qty_type = strategy.cash, precision = 2, slippage = 50, commission_value = 0.03, backtest_fill_limits_assumption = 50)

// ------ Date filter (obtained from ZenAndTheArtOfTrading) ---------

initial_date = input(title="Initial date", defval=timestamp("10 Feb 2014 13:30 +0000"), group="Time filter", tooltip="Enter the start date and time of the strategy")
final_date   = input(title="Final date", defval=timestamp("01 Jan 2030 19:30 +0000"), group="Time filter", tooltip="Enter the end date and time of the strategy")
dateFilter(int st, int et) => time >= st and time <= et
colorDate = input.bool(defval=false, title="Date background", tooltip = "Add color to the period of time of the strategy tester")
bgcolor(colorDate and dateFilter(initial_date, final_date) ? color.new(color.blue, transp=90) : na)

// ------------ Super Trend ----------

atrPeriod = input(9, "ATR Length SuperTrend")
factor = input.float(2.5, "Factor SuperTrend", step = 0.05)
[supertrend, direction] = ta.supertrend(factor, atrPeriod)
show_supertrend = input.bool(defval = false, title="Show supertrend ?", group = "Appearance")
bodyMiddle = plot(show_supertrend ? ((open + close) / 2) : na, display=display.none)
upTrend = plot(show_supertrend and direction < 0 ? supertrend : na, "Up Trend", color = color.green, style=plot.style_linebr)
downTrend = plot(show_supertrend and direction > 0 ? supertrend : na, "Down Trend", color = color.red, style=plot.style_linebr)
fill(bodyMiddle, upTrend, color.new(color.green, 90), fillgaps=false)
fill(bodyMiddle, downTrend, color.new(color.red, 90), fillgaps=false)

// ---------- Atr stop loss (obtained from garethyeo)

source_atr = input(close, title='Source', group = "Atr stop loss", inline = "A")
length_atr = input.int(14, minval=1, title='Period', group = "Atr stop loss" , inline = "A")
multiplier = input.float(1.5, minval=0.1, step=0.1, title='Atr multiplier', group = "Atr stop loss", inline = "A", tooltip = "Defines the stop loss distance based on the Atr stop loss indicator")
shortStopLoss = source_atr + ta.atr(length_atr) * multiplier
longStopLoss = source_atr - ta.atr(length_atr) * multiplier
show_atr_stoploss = input.bool(defval=false, title="Show Atr stop loss ?", group = "Appearance")
plot(show_atr_stoploss ? longStopLoss : na, color=color.white, style = plot.style_circles)
plot(show_atr_stoploss ? shortStopLoss : na, color=color.white, style = plot.style_circles)

// ------------- Money management --------------

strategy_contracts = strategy.equity / close
distance_sl_atr_long = -1 * (longStopLoss - close) / close
distance_sl_atr_short = (shortStopLoss - close) / close
risk = input.float(2.5, '% Account risk per trade', step=1, group = "Risk management for trades", tooltip = "Percentage of total account to risk per trade")
long_amount = strategy_contracts * (risk / 100) / distance_sl_atr_long
short_amount = strategy_contracts * (risk / 100) / distance_sl_atr_short

// ---------- Risk management ---------------

risk_reward_breakeven_long= input.float(title="Risk/reward for breakeven long", defval=0.75, step=0.05, group = "Risk management for trades")
risk_reward_take_profit_long= input.float(title="Risk/reward for take profit long", defval=0.75, step=0.05, group = "Risk management for trades")
risk_reward_breakeven_short= input.float(title="Risk/reward for break even short", defval=0.75, step=0.05, group = "Risk management for trades")
risk_reward_take_profit_short= input.float(title="Risk/reward for take profit short", defval=0.75, step=0.05, group = "Risk management for trades")
tp_percent=input.float(title="% of trade for first take profit", defval=50, step=5, group = "Risk management for trades", tooltip = "Closing percentage of the current position when the first take profit is reached.")

// ------------ Trade conditions ---------------

bought = strategy.position_size > 0
sold = strategy.position_size < 0
long_supertrend=ta.crossover(close, supertrend)
short_supertrend=ta.crossunder(close, supertrend)
var float sl_long = na
var float sl_short = na
var float be_long = na
var float be_short = na
var float tp_long = na
var float tp_short = na
if not bought
    sl_long:=na
if not sold
    sl_short:=na

// ---------- Strategy -----------

// Long position

if not bought and long_supertrend
    sl_long:=longStopLoss
    long_stoploss_distance = close - longStopLoss
    be_long := close + long_stoploss_distance * risk_reward_breakeven_long
    tp_long:=close+(long_stoploss_distance*risk_reward_take_profit_long)
    strategy.entry('L', strategy.long, long_amount, alert_message = "Long")
    strategy.exit("Tp", "L", stop=sl_long, limit=tp_long, qty_percent=tp_percent)
    strategy.exit('Exit', 'L', stop=sl_long)
if high > be_long
    sl_long := strategy.position_avg_price
    strategy.exit("Tp", "L", stop=sl_long, limit=tp_long, qty_percent=tp_percent)
    strategy.exit('Exit', 'L', stop=sl_long)
if bought and short_supertrend
    strategy.close("L", comment="CL")

// Short position

if not sold and short_supertrend
    sl_short:=shortStopLoss
    short_stoploss_distance=shortStopLoss - close
    be_short:=((short_stoploss_distance*risk_reward_breakeven_short)-close)*-1
    tp_short:=((short_stoploss_distance*risk_reward_take_profit_short)-close)*-1
    strategy.entry("S", strategy.short, short_amount, alert_message = "Short")
    strategy.exit("Tp", "S", stop=sl_short, limit=tp_short, qty_percent=tp_percent)
    strategy.exit("Exit", "S", stop=sl_short)
if low < be_short
    sl_short:=strategy.position_avg_price
    strategy.exit("Tp", "S", stop=sl_short, limit=tp_short, qty_percent=tp_percent)
    strategy.exit("Exit", "S", stop=sl_short)
if sold and long_supertrend
    strategy.close("S", comment="CS")

// ---------- Draw position on chart -------------

if high>tp_long
    tp_long:=na
if low<tp_short
    tp_short:=na
if high>be_long
    be_long:=na
if low<be_short
    be_short:=na

show_position_on_chart = input.bool(defval=true, title="Draw position on chart ?", group = "Appearance", tooltip = "Activate to graphically display profit, stop loss and break even")
position_price = plot(show_position_on_chart? strategy.position_avg_price : na, style=plot.style_linebr, color = color.new(#ffffff, 10), linewidth = 1)

sl_long_price = plot(show_position_on_chart and bought ? sl_long : na, style = plot.style_linebr, color = color.new(color.red, 10), linewidth = 1)
sl_short_price = plot(show_position_on_chart and sold ? sl_short : na, style = plot.style_linebr, color = color.new(color.red, 10), linewidth = 1)

tp_long_price = plot(strategy.position_size>0 and show_position_on_chart? tp_long : na, style = plot.style_linebr, color = color.new(#11eb47, 10), linewidth = 1)
tp_short_price = plot(strategy.position_size<0 and show_position_on_chart? tp_short : na, style = plot.style_linebr, color = color.new(#11eb47, 10), linewidth = 1)

breakeven_long = plot(strategy.position_size>0 and high<be_long and show_position_on_chart ? be_long : na , style = plot.style_linebr, color = color.new(#00ff40, 60), linewidth = 1)
breakeven_short = plot(strategy.position_size<0 and low>be_short and show_position_on_chart ? be_short : na , style = plot.style_linebr, color = color.new(#00ff40, 60), linewidth = 1)

position_profit_long = plot(bought and show_position_on_chart and strategy.openprofit>0 ? close : na, style = plot.style_linebr, color = color.new(#4cd350, 10), linewidth = 1)
position_profit_short = plot(sold and show_position_on_chart and strategy.openprofit>0 ? close : na, style = plot.style_linebr, color = color.new(#4cd350, 10), linewidth = 1)

fill(plot1 = position_price, plot2 = position_profit_long, color = color.new(color.green,90))
fill(plot1 = position_price, plot2 = position_profit_short, color = color.new(color.green,90))

fill(plot1 = position_price, plot2 = sl_long_price, color = color.new(color.red,90))
fill(plot1 = position_price, plot2 = sl_short_price, color = color.new(color.red,90))

fill(plot1 = position_price, plot2 = tp_long_price, color = color.new(color.green,90))
fill(plot1 = position_price, plot2 = tp_short_price, color = color.new(color.green,90))