概述
该策略通过计算快线EMA(3)、慢线EMA(11)和再慢线EMA(18)的交叉情况,结合MACD的零轴交叉来决定入场和出场。是一个利用双EMA和MACD指标进行交易决策的动态策略。
策略原理
该策略主要基于两个技术分析指标:
EMA均线交叉。通过快线EMA(3)、慢线EMA(11)和再慢线EMA(18)的交叉判断趋势,并作为入场出场信号。
MACD指标及其零轴交叉。 MACD由差离值(DIFF)和DEA组成。DIFF为快线EMA(3)减去慢线EMA(11)构成。DEA为MACD的EMA(27)。 MACD>0表示多头,MACD表示空头。零轴交叉则作为入场出场信号。
根据EMA交叉和MACD零轴交叉的组合情况,设定三次入场机会和两次出场机会:
- MACD在零轴上方且向上交叉为第一次做多机会
- 快线EMA(3)上穿慢线EMA(11)为第二次做多机会
- 快线EMA(3)上穿慢线EMA(18)为第三次满仓做多机会
- 快线EMA(3)下穿慢线EMA(11)为第一次清仓做空机会
- MACD在零轴下方且向下交叉为第二次清仓做空机会
总体来说,该策略综合双EMA交叉系统和MACD指标,通过动态调整均线参数和MACD参数,可以提高策略盈利能力。
策略优势
充分利用了EMA均线交叉和MACD指标的优势,综合双重指标判断,提高准确度。
设置三次做多机会,两次清仓机会,使策略交易频次增加,盈利空间扩大。
动态参数优化的空间大。快线EMA、慢线EMA、零轴EMA和MACD长度都可优化调整。
策略逻辑清晰易理解,便于调试与优化。
策略风险
EMA交叉和MACD指标都会产生一定误报比例,可能导致不必要的亏损。
交易频次高,每次止损幅度小,亏损有积累风险。
参数优化难度大,不当优化可能会过拟合历史数据。
需充分考量交易成本的影响。
针对风险:
1)合理设置止损,缩小单笔亏损。
2)适当调整参数,防止过拟合。
3)考虑成本的影响,如减少交易频次。
策略优化方向
更换其他指标试验:如布林带,KDJ等。
优化EMA均线交叉的参数:改变快线EMA和慢线EMA的长度参数。
优化MACD的参数:改变MACD的DIFF和DEA计算EMA长度。
增加止损策略:如交易次数止损,时间止损,移动止损等。
考量交易成本的影响,调整入场次数。
总结
本策略通过双EMA交叉系统和MACD指标的组合,构建一个交易频次高、盈利潜力大的动态参数策略。同时策略逻辑简单清晰,易于理解和优化调整。但也存在一定的误报风险和参数优化难度,这需要通过合理止损、防过拟合等方法来应对。总的来说,该策略具有很强的实用性。
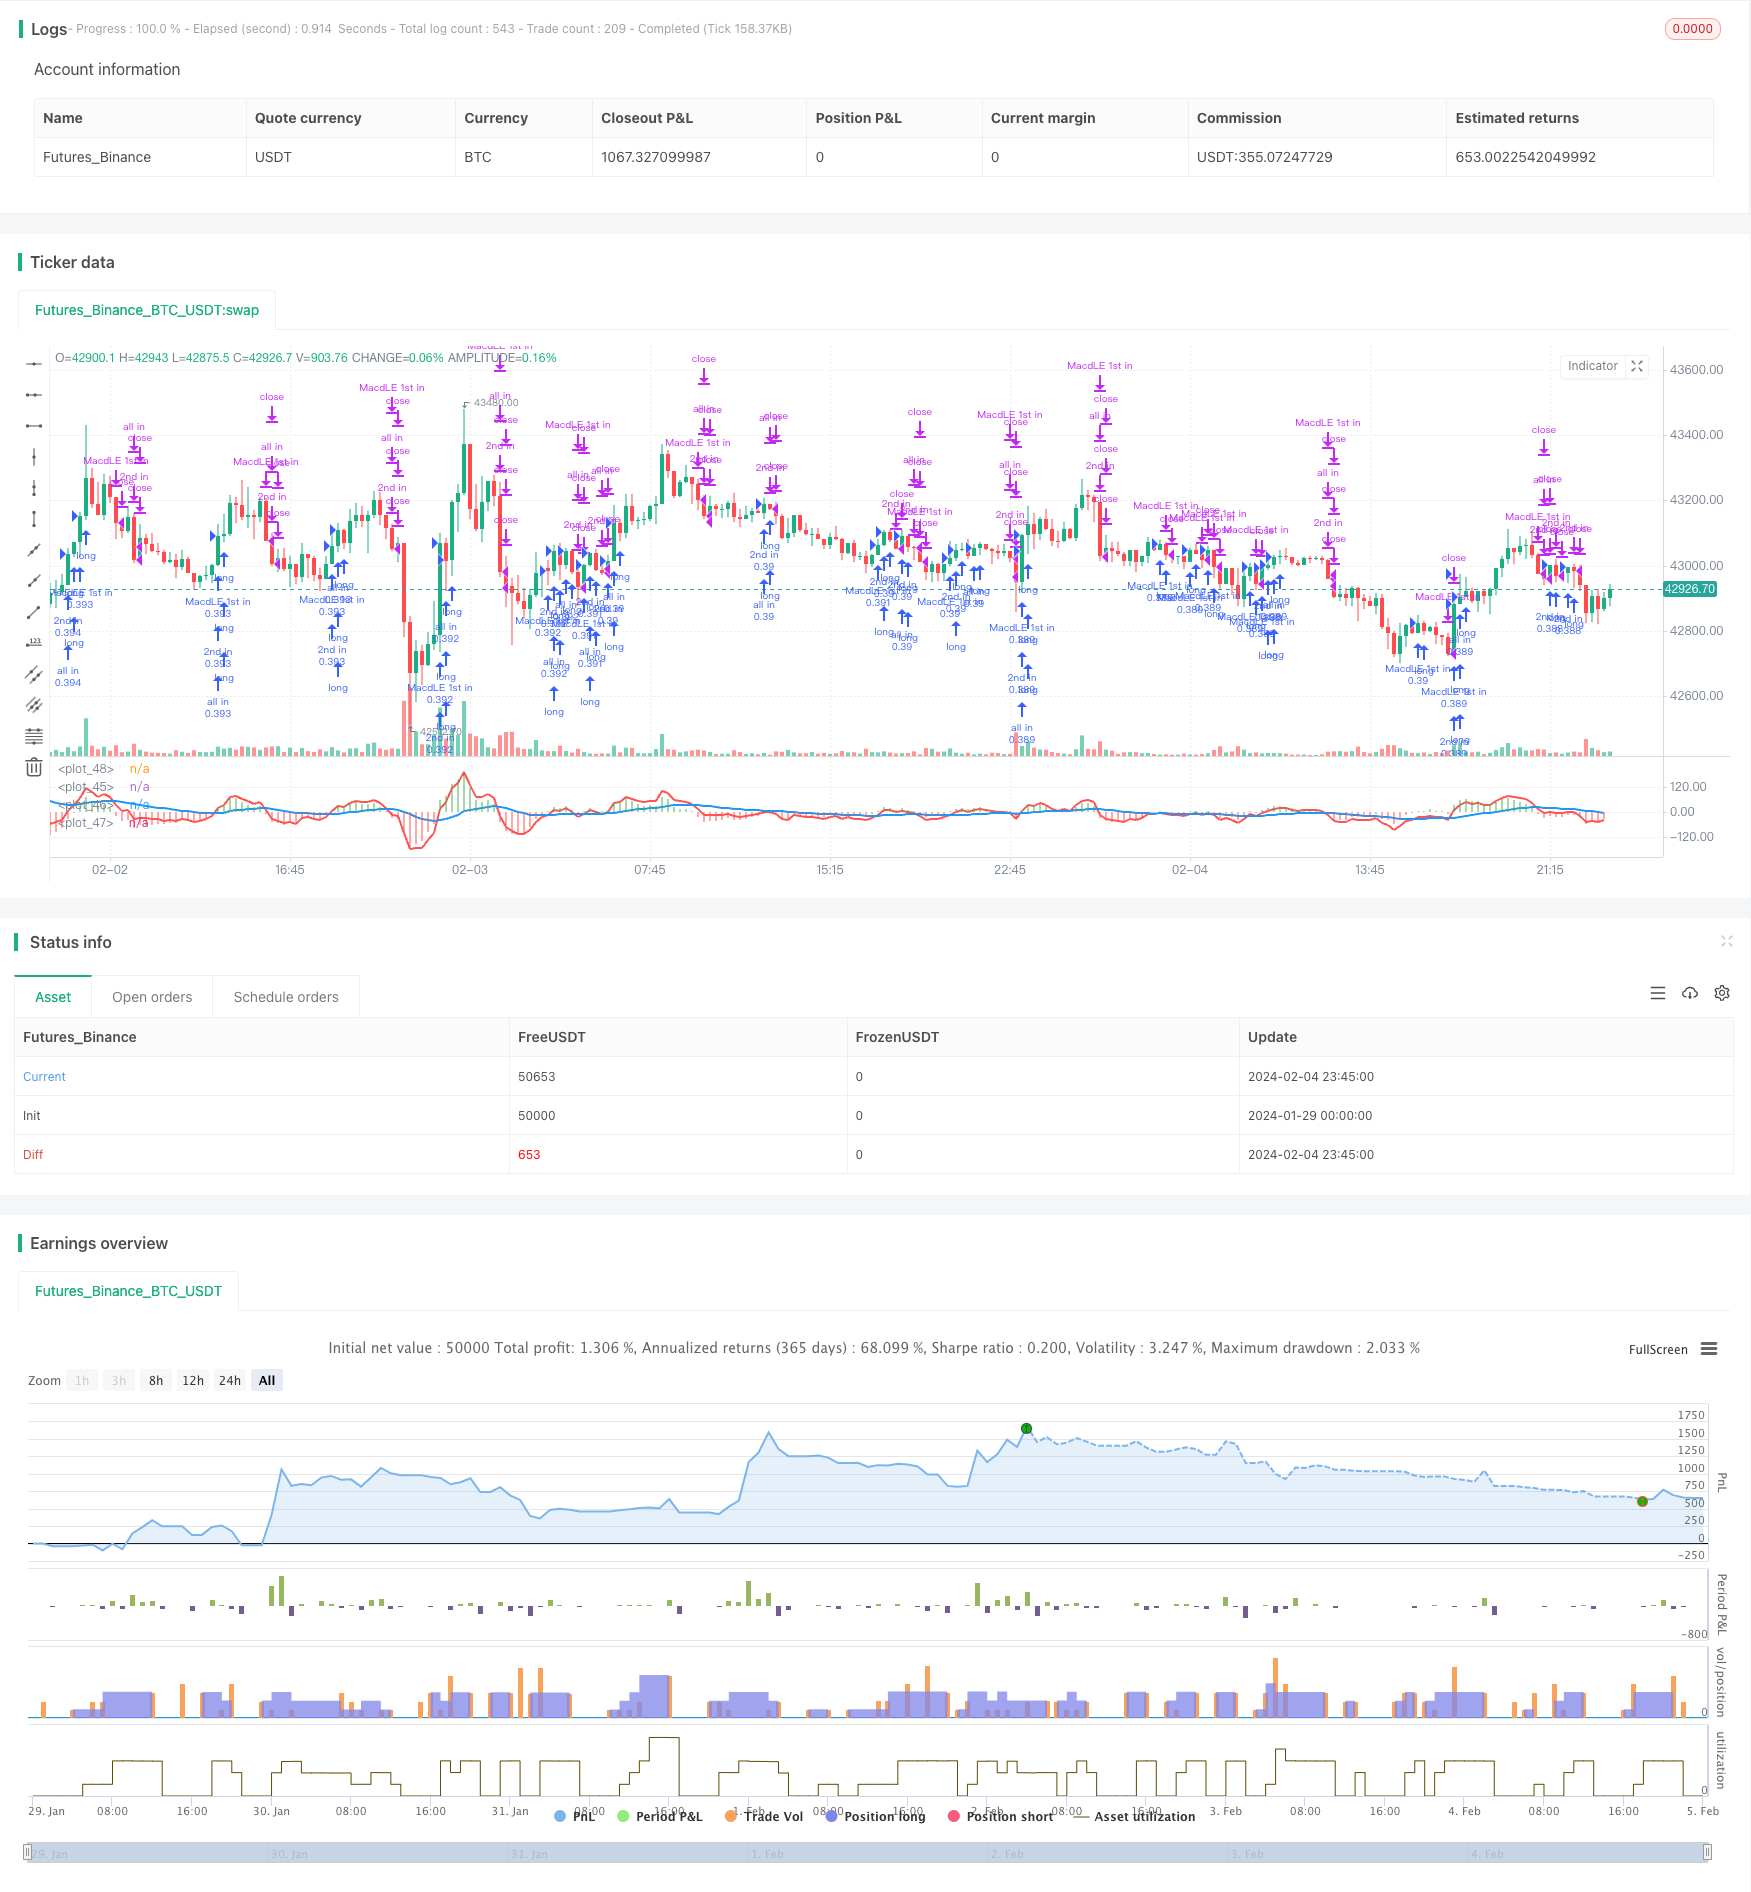
/*backtest
start: 2024-01-29 00:00:00
end: 2024-02-05 00:00:00
period: 15m
basePeriod: 5m
exchanges: [{"eid":"Futures_Binance","currency":"BTC_USDT"}]
*/

//@version=4
strategy("MACD+EMA crossovers Strategy custom",initial_capital=10000,max_bars_back=150,commission_type=strategy.commission.percent , commission_value=0.1, shorttitle="MACD+EMAcross",pyramiding = 10,default_qty_type=strategy.percent_of_equity,default_qty_value=33,overlay=false)

short = ema(close,3)
long = ema(close, 11)
long2 = ema(close, 18)
//plot(short, color = red, linewidth = 4)
//plot(long, color = blue, linewidth = 4)
//plot(long2, color = green, linewidth = 4)

isCross1 = crossover(short, long)
isCross2 = crossover(short, long2)
isCrossSell = crossunder(short, long)
//isCross3 = crossover(long, long2)

//plotshape(isCross1 and not isCross2, color=lime, style=shape.arrowup, text="1st in",size = size.tiny, location = location.belowbar)
//plotshape(isCross2 , color=lime, style=shape.arrowup, text="2nd in",size = size.tiny, location = location.belowbar)

//plotshape(isCross3 , color=lime, style=shape.arrowdown, text="All in",size = size.normal, location = location.abovebar)

//plotshape(isCrossSell , color=red, style=shape.arrowdown, text="SELL",size = size.small, location = location.abovebar)

fastLength = input(3)
slowlength = input(11)
MACDLength = input(27)

MACD = ema(close, fastLength) - ema(close, slowlength)
aMACD = ema(MACD, MACDLength) //signal
delta = MACD - aMACD // histograma

strategy.entry("MacdLE 1st in", strategy.long, comment="MacdLE 1st in",when=crossover(delta, 0))

strategy.entry("2nd in", strategy.long, comment="2nd in",when=isCross1)

strategy.entry("all in", strategy.long, comment="all in",when=isCross2)

strategy.close("2nd in",when=isCrossSell)
strategy.close("all in",when=isCrossSell)
//strategy.close("2nd in",when=crossunder(delta, 0))
//strategy.close("all in",when=crossunder(delta, 0))
strategy.close("MacdLE 1st in",when=crossunder(delta, 0))

histColour = (delta > 0) ? green : (delta < 0) ? red :  #4169E1

plot(MACD,color=red,linewidth=2)
plot(aMACD,color=blue,linewidth=2)
plot(delta,style=histogram, color=histColour, linewidth=10)
plot(0,color=white)