Bollinger Band Breakout Strategy Based on VWAP

Author: ChaoZhang, Date: 2024-02-06 14:36:26
Tags:

img

Overview

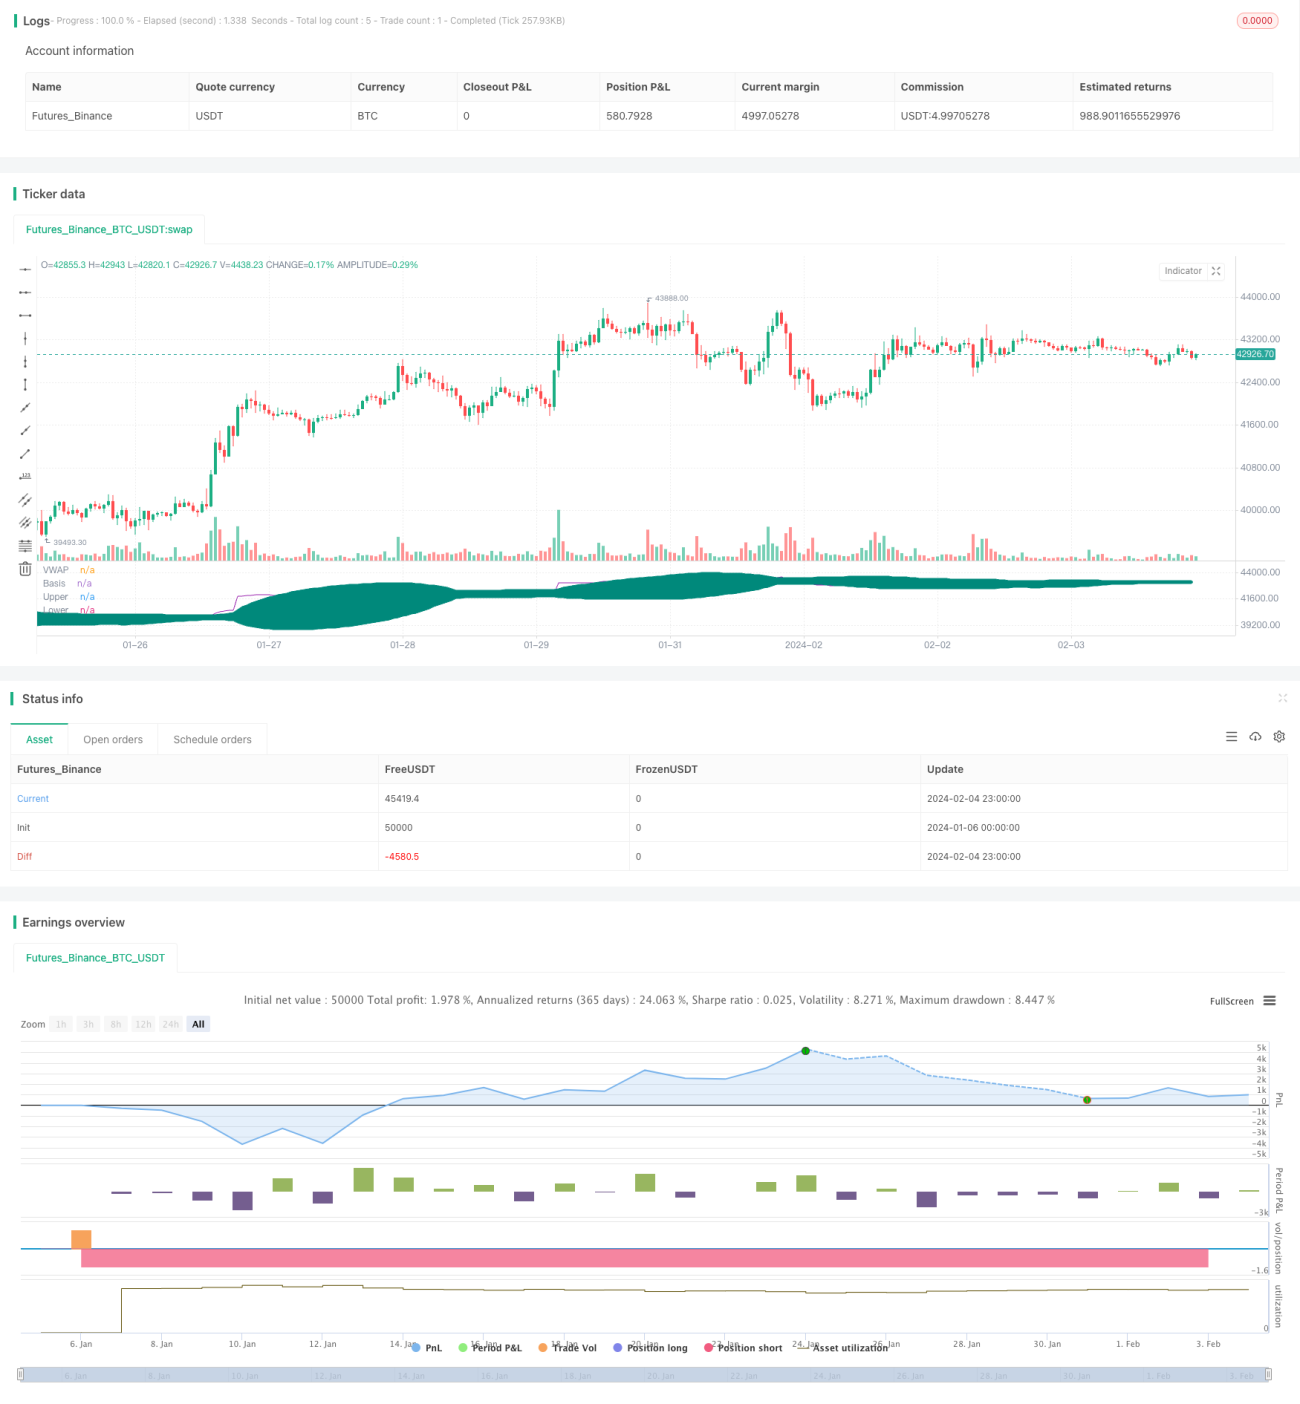
This strategy uses Bollinger Bands to track VWAP. It adopts a long position when VWAP breaks above the middle band, and closes position when VWAP breaks below the lower band. Pivot Point is also used as an auxiliary signal for entry, to avoid false breakouts.

Strategy Logic

  1. Calculate VWAP.
  2. Calculate Bollinger Bands of VWAP, including upper, middle and lower bands.
  3. Take long position when VWAP breaks above middle band and price is above Pivot Point.
  4. Set stop loss at 5%.
  5. If VWAP breaks below lower band, close long position. If stop loss is triggered, also exit.

Advantage Analysis

  1. VWAP has strong trend tracking ability. With BB, it accurately identifies trend start.
  2. Adding Pivot Point filters out false breakouts, avoiding unnecessary losses.
  3. Partial exit locks in some profits and controls risk.
  4. Backtests show great performance in bull market with good stability.

Risk Analysis

  1. Prone to losses from false breakouts in range-bound market.
  2. Pivot Points cannot fully avoid false signals. More filters needed.
  3. Increased trade frequency leads to higher transaction costs.
  4. Does not perform well in bear market. Good risk control required.

Optimization Directions

  1. Add indicators like MACD, KDJ to filter signals.
  2. Optimize BB parameters through backtests.
  3. Use machine learning to dynamically optimize BB parameters.
  4. Test different stop loss levels to find optimum.
  5. Add adaptive take profit based on market volatility.

Conclusion

A stable breakout system suitable for algorithm trading. Attention is needed on risk control. With further research and optimization, it could become an excellent breakout strategy.


/*backtest
start: 2024-01-06 00:00:00
end: 2024-02-05 00:00:00
period: 1h
basePeriod: 15m
exchanges: [{"eid":"Futures_Binance","currency":"BTC_USDT"}]
*/

// This source code is subject to the terms of the Mozilla Public License 2.0 at https://mozilla.org/MPL/2.0/
// © ediks123

//@version=4
strategy("BBofVWAP with entry at Pivot Point", overlay=false, pyramiding=1,   default_qty_type=strategy.percent_of_equity,  default_qty_value=20, initial_capital=10000, currency=currency.USD)  //default_qty_value=10, default_qty_type=strategy.fixed,

// Function outputs 1 when it's the first bar of the D/W/M/Y
is_newbar(res) =>
    ch = 0
    if(res == 'Y')
        t  = year(time('D'))
        ch := change(t) != 0 ? 1 : 0
    else
        t = time(res)
        ch := change(t) != 0 ? 1 : 0
    ch


//variables BEGIN
//smaLength=input(200,title="Slow MA Length")

bbLength=input(50,title="BB Length")  
//bbsrc = input(close, title="BB Source")
mult = input(2.0, minval=0.001, maxval=50, title="StdDev")
offset = input(0, "Offset", type = input.integer, minval = -500, maxval = 500)

pp_period = input(title = "Pivot Period", type=input.string, defval="Week", options = ['Day', 'Week'])

pp_res = pp_period == 'Day' ? 'D' : pp_period == 'Week' ? 'W' : pp_period == 'Month' ? 'M' : 'Y' 

riskCapital = input(title="Risk % of capital", defval=10, minval=1)
stopLoss=input(5,title="Stop Loss",minval=1)


//sma200=sma(close,smaLength)
//plot(sma200, title="SMA 200", color=color.orange)

myVwap=vwap(hlc3)

//bollinger calculation
basis = sma(myVwap, bbLength)
dev = mult * stdev(myVwap, bbLength)
upperBand = basis + dev
lowerBand = basis - dev

//plot bb
plot(basis, "Basis", color=color.teal, style=plot.style_circles , offset = offset)
p1 = plot(upperBand, "Upper", color=color.teal, offset = offset)
p2 = plot(lowerBand, "Lower", color=color.teal, offset = offset)
fill(p1, p2, title = "Background", color=color.teal, transp=95)

plot(myVwap, title="VWAP", color=color.purple)


//pivot points 


// Calc High
high_cur = 0.0
high_cur := is_newbar(pp_res) ? high : max(high_cur[1], high)

phigh = 0.0
phigh := is_newbar(pp_res) ? high_cur[1] : phigh[1]

// Calc Low
low_cur = 0.0
low_cur := is_newbar(pp_res) ? low : min(low_cur[1], low)

plow = 0.0
plow := is_newbar(pp_res) ? low_cur[1] : plow[1]

// Calc Close
pclose = 0.0
pclose := is_newbar(pp_res) ? close[1] : pclose[1]


vPP = (phigh + plow + pclose) / 3

//pivot points


//Entry--
//Echeck how many units can be purchased based on risk manage ment and stop loss
qty1 = (strategy.equity  * riskCapital / 100 ) /  (close*stopLoss/100)  

//check if cash is sufficient  to buy qty1  , if capital not available use the available capital only
qty1:= (qty1 * close >= strategy.equity ) ? (strategy.equity / close) : qty1


strategy.entry(id="BB_VWAP_PP",long=true, qty=qty1, when=   crossover(myVwap,basis)  and close>=vPP  )

bgcolor(strategy.position_size>=1?color.blue:na, transp=75)
barcolor(strategy.position_size>=1?color.green:na)

stopLossVal=  strategy.position_size>=1 ?  close * (1 - (stopLoss*0.01) ) : 0.00

//partial exit
//strategy.close(id="BBofVwap", qty=strategy.position_size/3, when=crossunder(myVwap,upperBand) and strategy.position_size>=1 )  //and close>strategy.position_avg_price)


//exit on lowerband or stoploss 
strategy.close(id="BB_VWAP_PP", comment="P" , qty=strategy.position_size/3, when= crossunder(myVwap,upperBand) and strategy.position_size>=1 and close>strategy.position_avg_price)  //
strategy.close(id="BB_VWAP_PP", comment="Exit All", when=crossunder(myVwap,lowerBand) and strategy.position_size>=1 )
//strategy.close(id="BBofVwapWithFibPivot", comment="Exit All", when=crossunder(close,vPP) and strategy.position_size>=1 )

strategy.close(id="BB_VWAP_PP", comment="Stop Loss Exit", when=crossunder(close,stopLossVal) and strategy.position_size>=1 )

More