概述
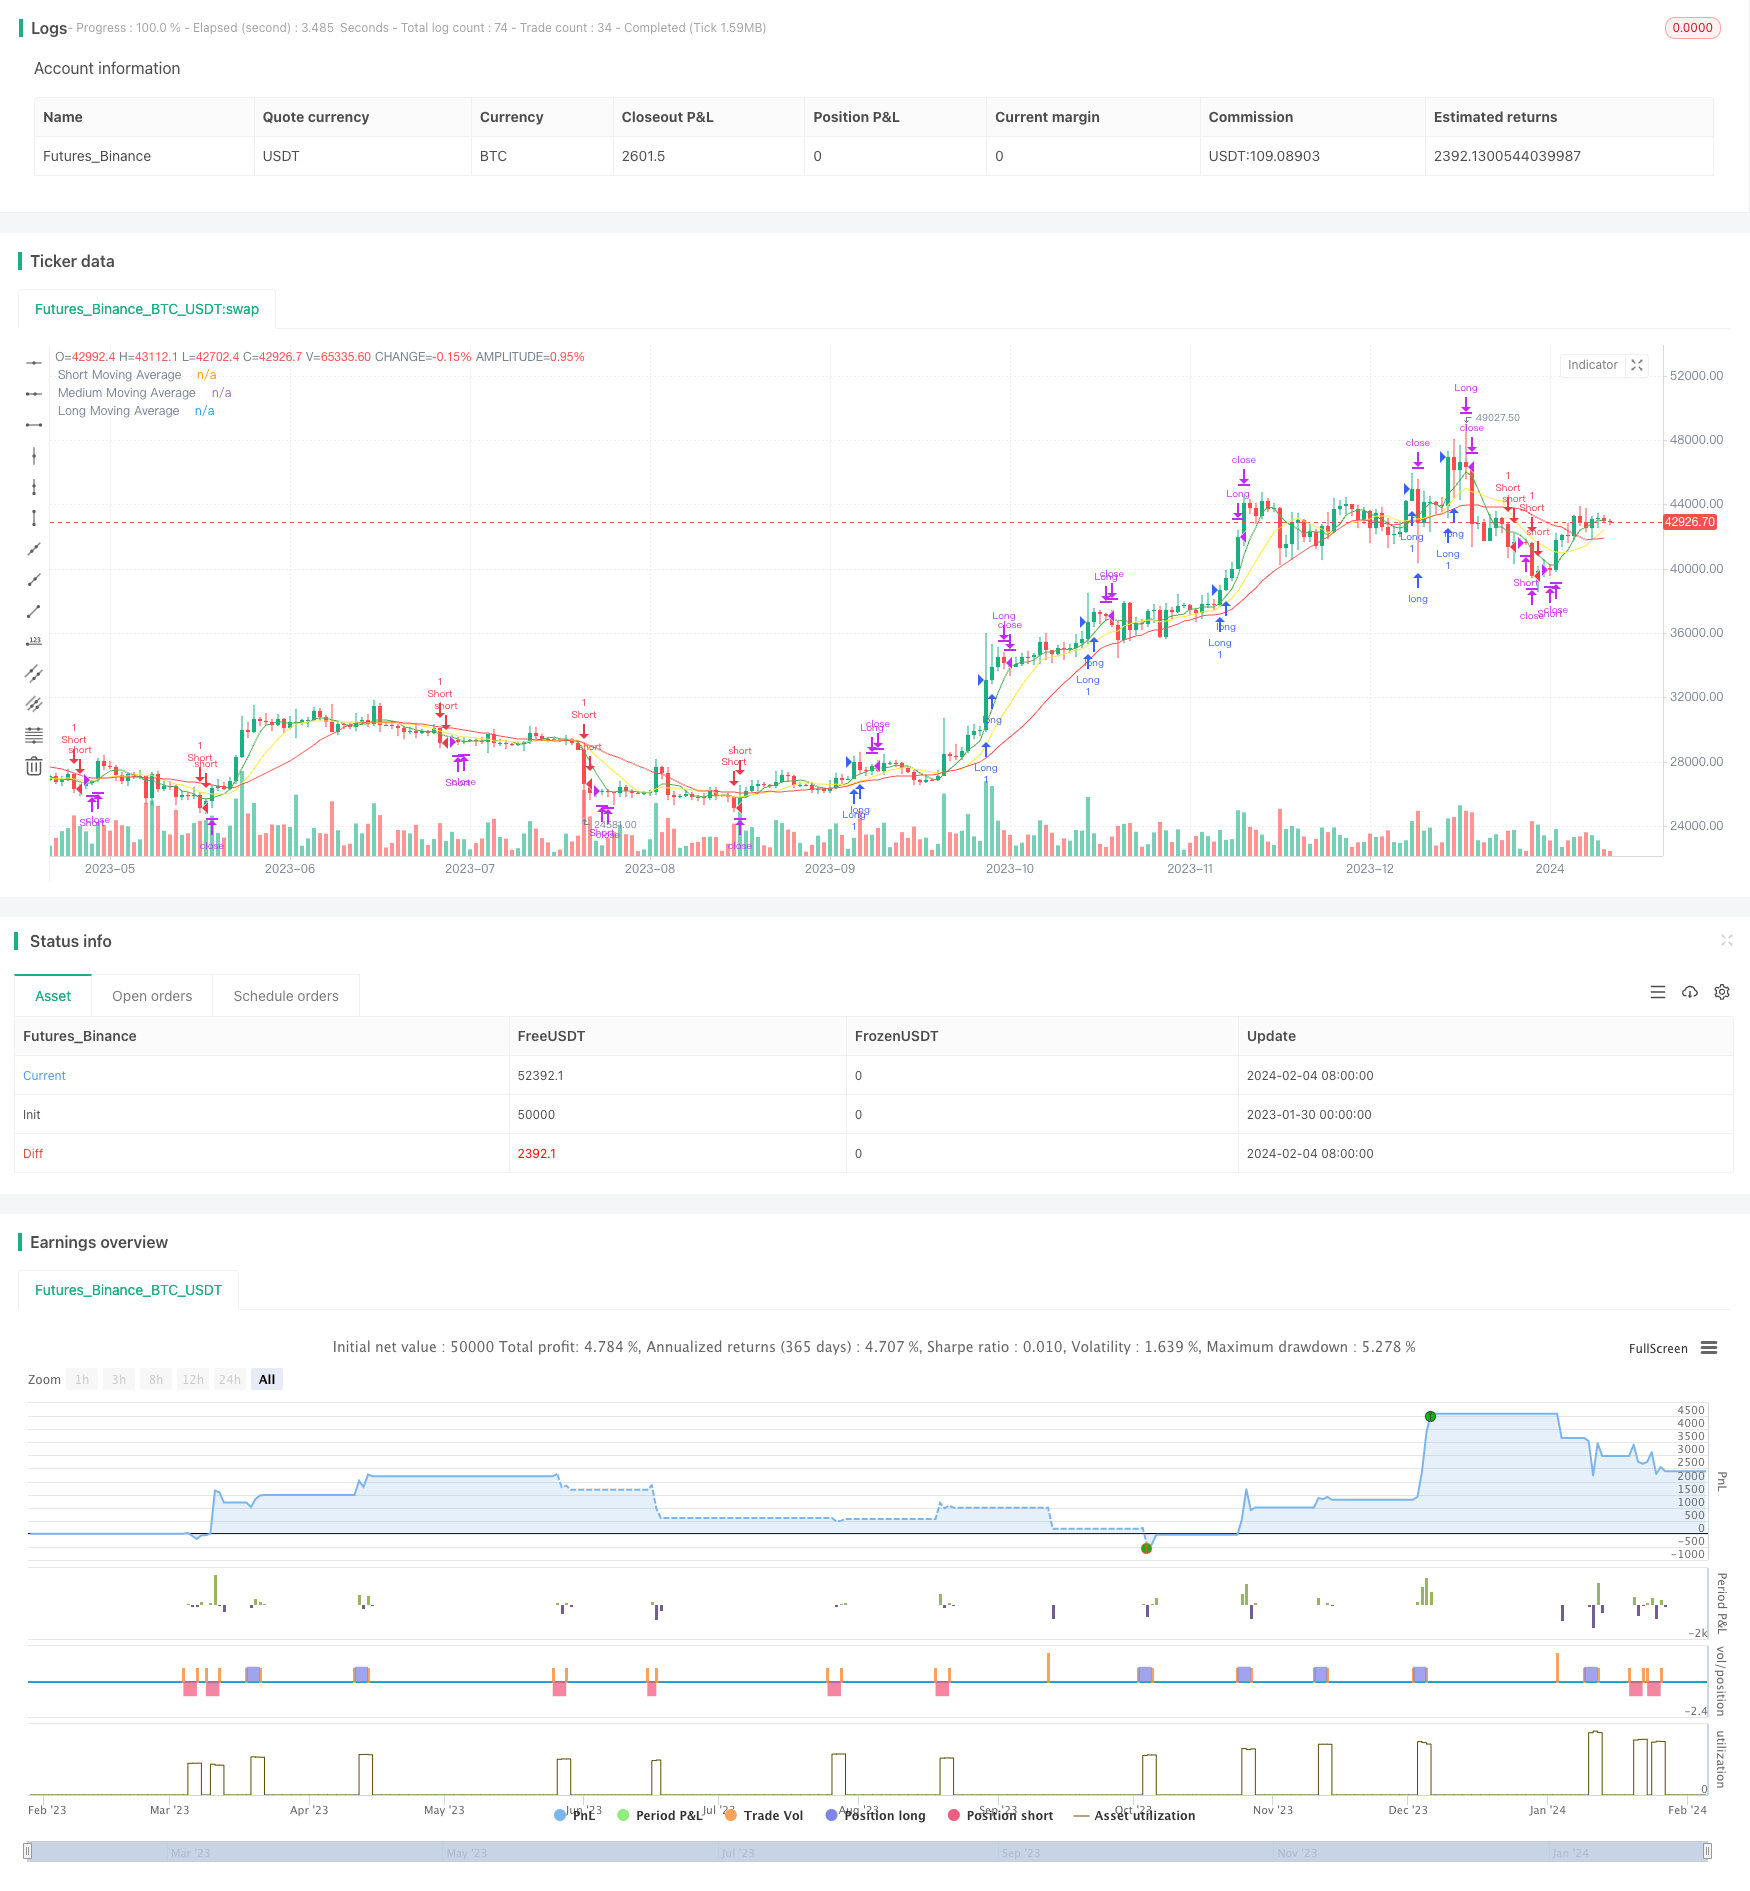
本策略运用三条不同周期的移动平均线,识别市场趋势方向。当三条移动平均线方向一致时,进入仓位。同时,结合最近N根K线的最高价或最低价,设定止损止盈。
策略原理
计算长期、中期、短期三条移动平均线。用户可以自行设置周期。默认为20日、10日、5日。
比较三条移动平均线的方向。当短期移动平均线上穿中期,中期上穿长期时,判断为多头市场。当短期移动平均线下穿中期,中期下穿长期时,判断为空头市场。
在多头市场中,如果价格突破最近N根K线内的最高价,做多;在空头市场中,如果价格突破最近N根K线内的最低价,做空。N也为用户自定义参数。
进入仓位后,设置止损止盈。多头市场止损为最近N根K线内的最低价,空头市场止损为最近N根K线内的最高价。
优势分析
本策略结合移动平均线指标和K线图形,能较好判断市场走势。同时,止损止盈设置合理,有利于规避较大亏损。
相比单一移动平均线等指标,本策略运用三条移动平均线,判断市场走势的可靠性更高。同时,突破最近N根K线最高价或最低价进入仓位,是比较常见的突破策略。整体而言,策略思路清晰,易于实施。
风险分析
该策略可能存在的主要风险有:
三条移动平均线方向判断失误的概率。如果中短期移动平均线造成错误信号,可能导致不必要的亏损。
突破进入时机选择不当,容易被套。应适当优化入场时机选择。
止损距离设置过小,扩大止损距离有助于给予价格更多Running Room。
优化方向
本策略可从以下几个方向进行优化:
增加其他指标过滤,确保移动平均线信号的可靠性。例如增加成交量的多空判断。
优化移动平均线的周期参数,使其更好适应不同品种。
增加机器学习算法,实现参数的自动优化。
在高频数据上测试该策略的有效性。
总结
本策略总体较为简单通用,思路清晰,实际可行性强。作为移动平均线交叉系统的范例,是初学者常见的选择。通过适当优化,可将系统运用到更广泛的品种和时间周期上,从而获得稳定收益。
/*backtest
start: 2023-01-30 00:00:00
end: 2024-02-05 00:00:00
period: 1d
basePeriod: 1h
exchanges: [{"eid":"Futures_Binance","currency":"BTC_USDT"}]
*/

// This Pine Script™ code is subject to the terms of the Mozilla Public License 2.0 at https://mozilla.org/MPL/2.0/
// © hobbiecode

//@version=5
strategy("Cross Breakout - Hobbiecode", shorttitle="Cross - HOBBIE", overlay=true)

// User-defined input for moving averages
long_period = input(20, title="Long Period")
medium_period =  input(10, title = "Medium Period")
short_period = input(5, title="Short Period")
type_ma = input.string("SMA", title = "MA type", options = ["SMA", "EMA"])
candles_back = input(10, title = "Candles Back")
bars_valid = input(3, title = "Bars to Exit")

// Calculating moving averages
long_ma = 0.0
medium_ma = 0.0
short_ma = 0.0

if type_ma == "SMA"
    long_ma := ta.sma(close, long_period)
    medium_ma := ta.sma(close, medium_period)
    short_ma := ta.sma(close, short_period)
else
    long_ma := ta.ema(close, long_period)
    medium_ma := ta.ema(close, medium_period)
    short_ma := ta.ema(close, short_period)

// Plot moving averages
plot(long_ma, title="Long Moving Average", color=color.red)
plot(medium_ma, title = "Medium Moving Average", color = color.yellow)
plot(short_ma, title="Short Moving Average", color=color.green)

// Check last min/max
last_min = ta.lowest(candles_back)
last_max = ta.highest(candles_back)

// Strategy logic for crossing of moving averages
longCondition = short_ma > medium_ma and medium_ma > long_ma and high == last_max
shortCondition = short_ma < medium_ma and medium_ma < long_ma and low == last_min

longCondition_entry = longCondition and strategy.position_size == 0
shortCondition_entry = shortCondition and strategy.position_size == 0

// Check last min/max for operation
last_min_op = ta.lowest(candles_back)[1]
last_max_op = ta.highest(candles_back)[1]

// Plot lines
var line r1Line = na

// Entry orders
// if (longCondition)
//     from_line = chart.point.now(high)
//     to_line = chart.point.from_index(bar_index + candles_back, high)
//     r1Line := line.new(from_line, to_line, color = color.green, width = 2)

if longCondition_entry and ta.crossover(close,last_max_op)
    strategy.entry("Long", strategy.long)
    strategy.exit("Exit Long", from_entry="Long", stop=low)

// if (shortCondition)
//     from_line = chart.point.now(low)
//     to_line = chart.point.from_index(bar_index + candles_back, low)
//     r1Line := line.new(from_line, to_line, color = color.red, width = 2)

if shortCondition_entry and ta.crossunder(close,last_min_op)
    strategy.entry("Short", strategy.short)
    strategy.exit("Exit Short", from_entry="Short", stop=high)

if ta.barssince(longCondition_entry) >= bars_valid
    strategy.close("Long")

if ta.barssince(shortCondition_entry) >= bars_valid
    strategy.close("Short")