概述
该策略通过输入不同类型的移动平均线构建布林带,从而发掘更多交易机会。它提供了12种移动平均线类型,可以灵活组合,以获得最佳参数。
策略原理
该策略的核心在于利用用户输入的移动平均线类型,包括SMA、EMA、WMA、DEMA、TMA、VAR、WWMA、ZLEMA、TSF、HULL、TILL等12种,结合布林带指标形成交易信号。布林带的中轨线采用选择的移动平均线,上下轨分别是中轨线正负一个标准差。当价格突破上轨线时,做空;当价格突破下轨线时,做多。这样通过不同移动平均线类型的组合,可以优化参数,获得更稳定和准确的交易信号。
代码主要分为以下部分: 1. 定义12种移动平均线类型的计算函数,包括SMA、EMA、WMA等。 2. getMA函数,根据mav输入参数返回相应的移动平均线。 3. 计算布林带的中轨线、上轨线、下轨线。中轨采用getMA函数得到的移动平均。 4. 绘制布林带。 5. 生成长信号和空信号。价格突破上轨时空头,突破下轨时多头。
优势分析
该策略最大的优势在于提供了多种移动平均线类型。不同市场环境下,移动平均线反应快慢不同,采用多类型移动平均可以大大增强策略的适应性。此外,该策略可以优化移动平均线长度参数,寻找最佳组合,从而获得更准确的交易信号。
风险分析
该策略的主要风险在于移动平均线本身信号混乱,可能出现多次虚假突破。此外,布林带指标对剧烈价格变动也比较敏感,中轨线无法有效跟踪价格。这就需要采用稳定性较强的移动平均线类型,并适当调整参数。
优化方向
该策略可以从以下几个方面进行优化:
1. 测试不同的移动平均线组合,寻找最佳参数,提高信号稳定性。
2. 增加止损策略,确保个别错误信号带来的损失控制。
3. 结合其他指标过滤信号,避免频繁交易。比如MACD,KD等。
4. 优化资金管理,调整仓位。
总结
该策略整体来说非常创新,为布林带指标提供了更丰富的细分应用。通过调整组合移动平均线,可以获得更加准确和稳定的信号。同时也为布林带策略的优化提供了新的思路。通过参数调整和优化,该策略可以成为一个非常实用的交易工具。
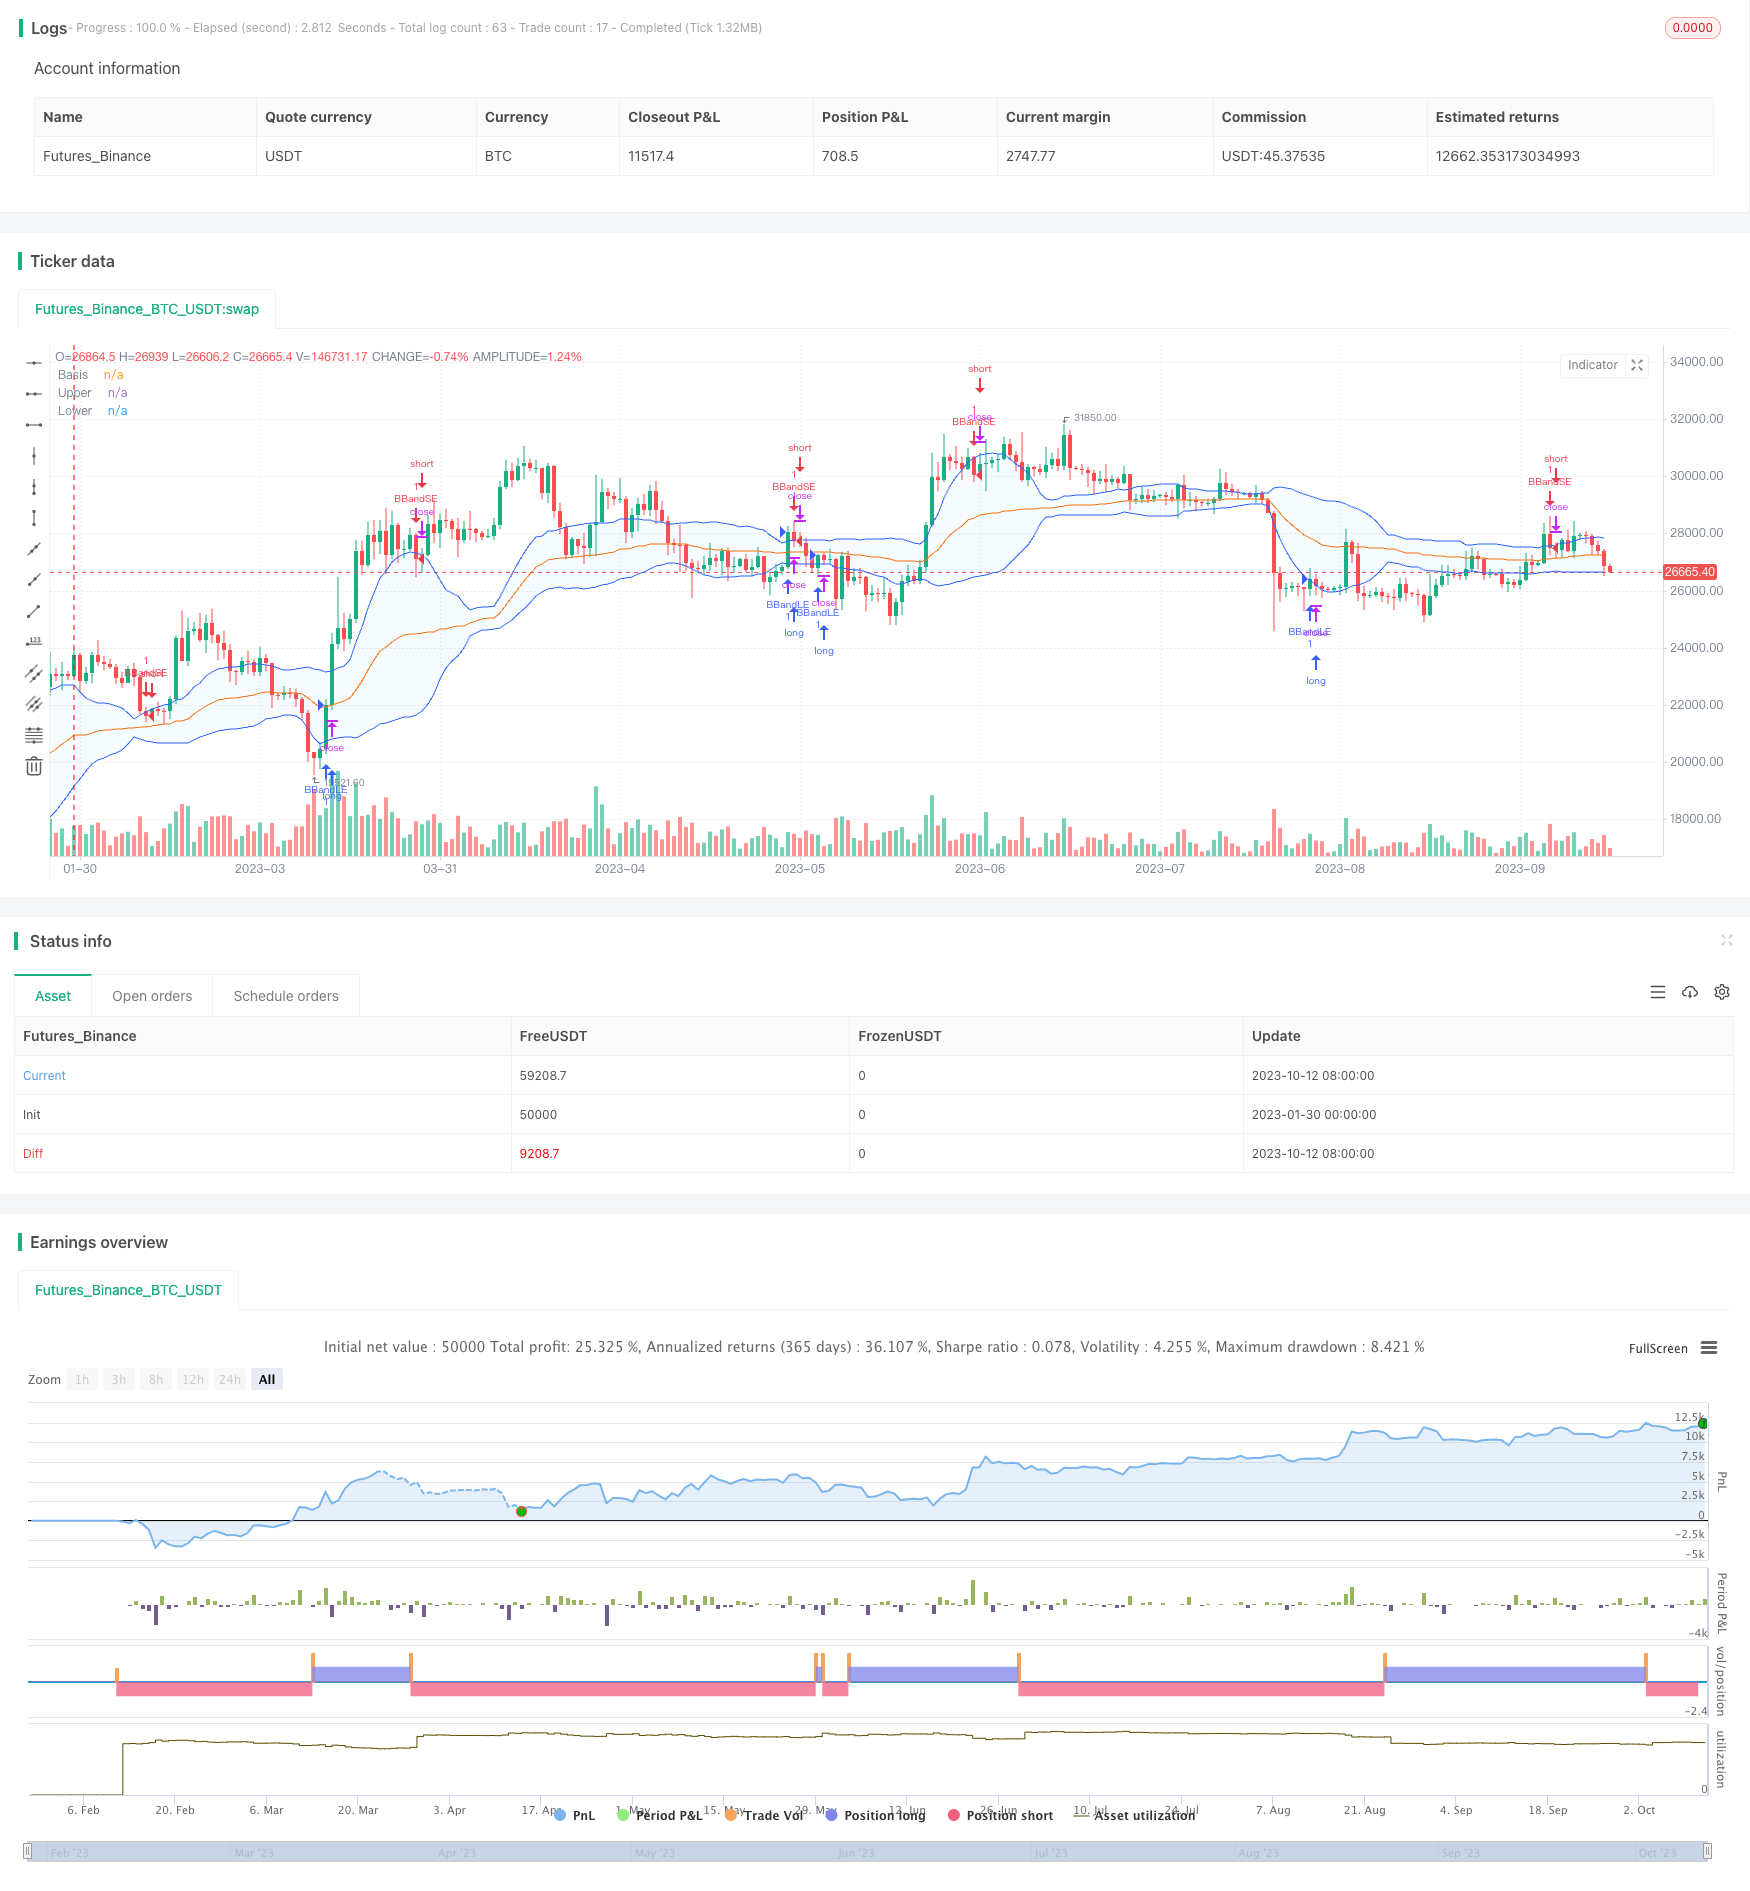
/*backtest
start: 2023-01-30 00:00:00
end: 2023-10-13 00:00:00
period: 1d
basePeriod: 1h
exchanges: [{"eid":"Futures_Binance","currency":"BTC_USDT"}]
*/

//@version=4
strategy("Bollinger Bands Strategy (MA type)", overlay=true)
src = input(close, title="Source")
length = input(20,step=10, minval=1)
mult = input(1,type=input.float, minval=0.001, maxval=50, title="StdDev")

length1=input(26, "Long Moving Average Length", minval=1)
length2=input(9, "Trigger Length", minval=1)
T3a1 = input(0.7, "TILLSON T3 Volume Factor", step=0.1)
////////////
mav = input(title="Moving Average Type", defval="VAR", options=["SMA", "EMA", "WMA", "DEMA", "TMA", "VAR", "WWMA", "ZLEMA", "TSF", "HULL", "TILL"])
Var_Func(src,length)=>
    valpha=2/(length+1)
    vud1=src>src[1] ? src-src[1] : 0
    vdd1=src<src[1] ? src[1]-src : 0
    vUD=sum(vud1,9)
    vDD=sum(vdd1,9)
    vCMO=nz((vUD-vDD)/(vUD+vDD))
    VAR=0.0
    VAR:=nz(valpha*abs(vCMO)*src)+(1-valpha*abs(vCMO))*nz(VAR[1])
VAR=Var_Func(src,length)
DEMA = ( 2 * ema(src,length)) - (ema(ema(src,length),length) )
Wwma_Func(src,length)=>
    wwalpha = 1/ length
    WWMA = 0.0
    WWMA := wwalpha*src + (1-wwalpha)*nz(WWMA[1])
WWMA=Wwma_Func(src,length)
Zlema_Func(src,length)=>
    zxLag = length/2==round(length/2) ? length/2 : (length - 1) / 2
    zxEMAData = (src + (src - src[zxLag]))
    ZLEMA = ema(zxEMAData, length)
ZLEMA=Zlema_Func(src,length)
Tsf_Func(src,length)=>
    lrc = linreg(src, length, 0)
    lrc1 = linreg(src,length,1)
    lrs = (lrc-lrc1)
    TSF = linreg(src, length, 0)+lrs
TSF=Tsf_Func(src,length)
HMA = wma(2 * wma(src, length / 2) - wma(src, length), round(sqrt(length)))
T3e1=ema(src, length)
T3e2=ema(T3e1,length)
T3e3=ema(T3e2,length)
T3e4=ema(T3e3,length)
T3e5=ema(T3e4,length)
T3e6=ema(T3e5,length)
T3c1=-T3a1*T3a1*T3a1
T3c2=3*T3a1*T3a1+3*T3a1*T3a1*T3a1
T3c3=-6*T3a1*T3a1-3*T3a1-3*T3a1*T3a1*T3a1
T3c4=1+3*T3a1+T3a1*T3a1*T3a1+3*T3a1*T3a1
T3=T3c1*T3e6+T3c2*T3e5+T3c3*T3e4+T3c4*T3e3


getMA(src, length) =>
    ma = 0.0
    if mav == "SMA"
        ma := sma(src, length)
        ma

    if mav == "EMA"
        ma := ema(src, length)
        ma

    if mav == "WMA"
        ma := wma(src, length)
        ma

    if mav == "DEMA"
        ma := DEMA
        ma

    if mav == "TMA"
        ma := sma(sma(src, ceil(length / 2)), floor(length / 2) + 1)
        ma

    if mav == "VAR"
        ma := VAR
        ma

    if mav == "WWMA"
        ma := WWMA
        ma

    if mav == "ZLEMA"
        ma := ZLEMA
        ma

    if mav == "TSF"
        ma := TSF
        ma

    if mav == "HULL"
        ma := HMA
        ma

    if mav == "TILL"
        ma := T3
        ma
    ma

//////////
basis = getMA(src, length)
dev = mult * stdev(src, length)
upper = basis + dev
lower = basis - dev
offset = input(0, "Offset",minval = -500, maxval = 500)
plot(basis, "Basis",color=#FF6D00, offset = offset)
p1 = plot(upper, "Upper", color=#2962FF, offset = offset)
p2 = plot(lower, "Lower", color=#2962FF, offset = offset)
fill(p1, p2, title = "Background", color=color.rgb(33, 150, 243, 95))
/////////
buyEntry = crossover(src, lower)
sellEntry = crossunder(src, upper)
if (crossover(src, lower))
	strategy.entry("BBandLE", strategy.long, stop=lower, oca_name="BollingerBands",  comment="BBandLE")
else
	strategy.cancel(id="BBandLE")
if (crossunder(src, upper))
	strategy.entry("BBandSE", strategy.short, stop=upper, oca_name="BollingerBands",  comment="BBandSE")
else
	strategy.cancel(id="BBandSE")
//plot(strategy.equity, title="equity", color=color.red, linewidth=2, style=plot.style_areabr)