概述
动量趋势优化组合策略是一种中长线量化交易策略,它结合了动量因子和趋势因子,通过指数移动平均线、移动平均线、成交量和斜率指标的组合生成买入和卖出信号。该策略对T+1交易进行了优化,只适用于做多方向。优化同样适用于国际股市。
策略原理
该策略使用6日简单移动平均线和35日简单移动平均线定义两个移动平均线。买入信号线定义为2日指数移动平均线,卖出信号线根据过去8日的收盘价计算斜率再平移。此外,还定义了20日成交量的指数移动平均线作为成交量指标。为了过滤掉部分Noise,策略还引入每周斜率多空判断。
当股票收盘价高于35日移动平均线,成交量高于20日成交量平均线,且按周检查为多头市场时,从下方黄金交叉触发买入信号;相反,从上方死亡交叉触发卖出信号。
风险管理方面,策略引入了动态仓位调整机制。根据账户权益、最大仓位比例、ATR和风险因子计算出实际仓位。这有助于控制策略的最大回撤。
优势分析
该策略结合动量因子和趋势过滤,能够有效识别中长线方向。同时,对 Noise 的过滤也较为到位,有利于在震荡行情中避免错信号。此外,风险管理机制的引入也使得最大回撤控制得当,从而保证了策略的稳健性。
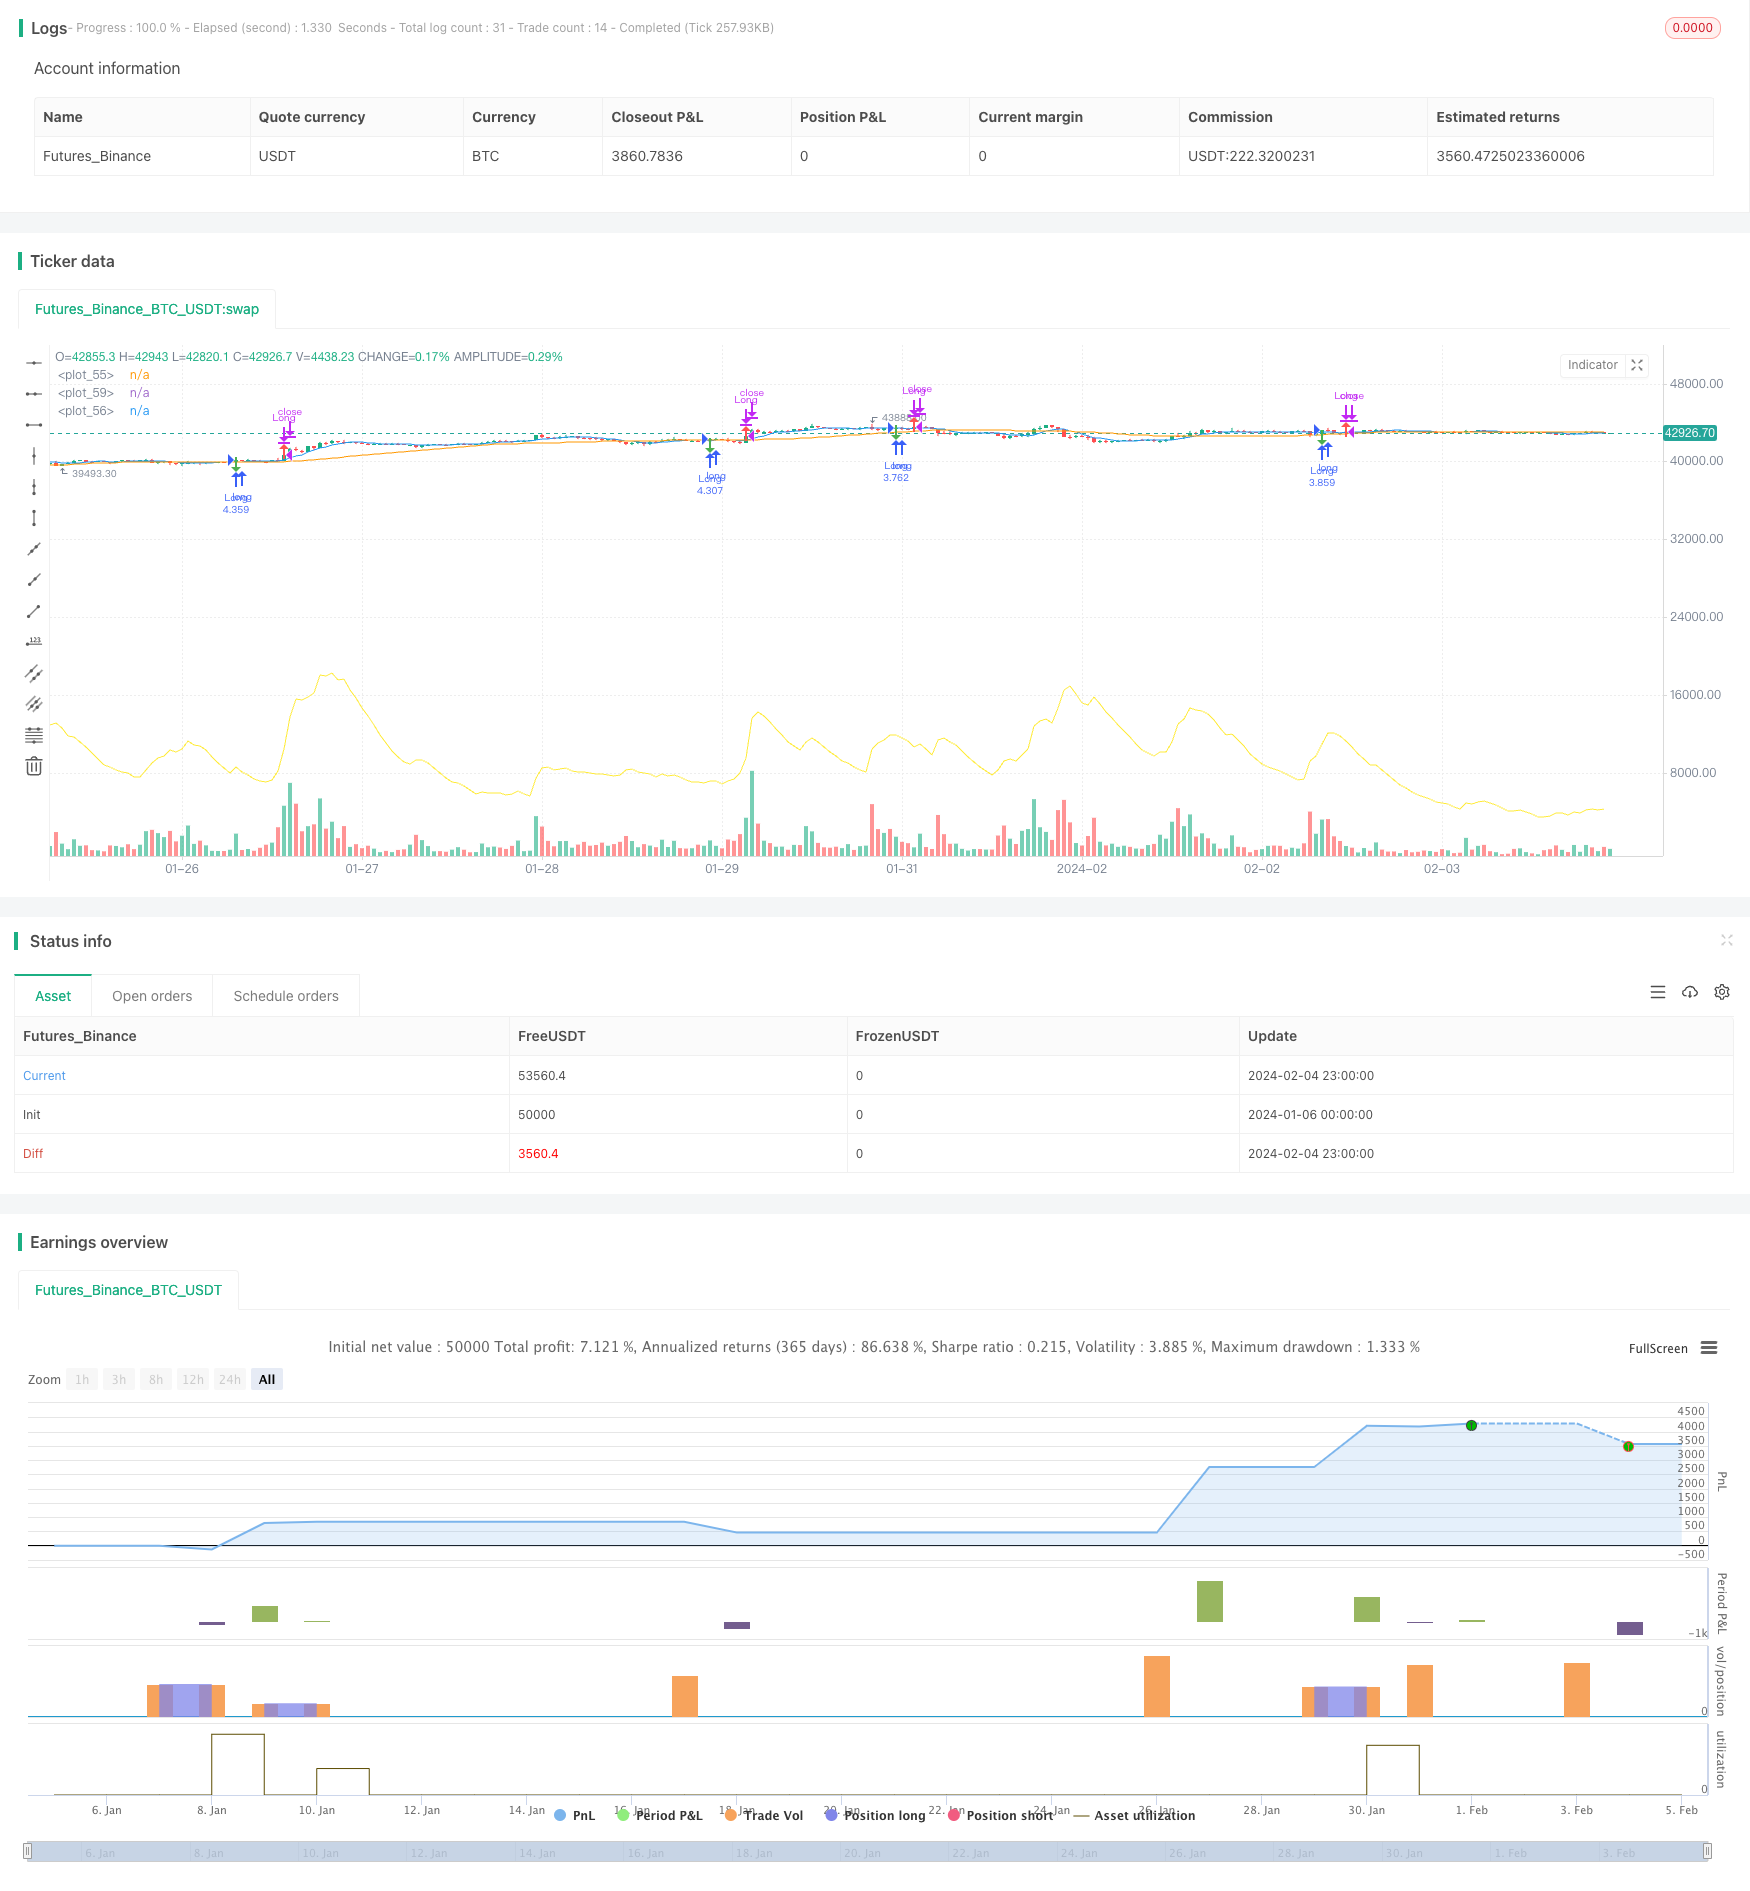
从回测结果看,策略整体收益率高达128.86%,具有非常显著的 Alpha。同时,策略的胜率也达到了60.66%,体现了策略效果的稳定性。
风险分析
尽管策略本身已经对风险管理机制进行了优化,但仍然存在一定的风险需要关注。具体来说,主要风险包括:
回撤风险。从单笔最大亏损222,021.46元可见,策略回撤幅度较大。这与仓位管理机制不完善有关。
信号稳定性风险。策略信号可能受到个股特殊因素的影响,从而出现误信号的情况。这会对策略收益造成一定冲击。
市场环境变化风险。如果宏观市场环境发生重大变化,策略参数可能需要进行调整才能继续保持效果。
优化方向
根据以上风险分析,该策略仍有优化的 necessity 和 possibility。
从最大亏损情况看,可以进一步优化仓位管理机制,引入止损模块,以控制单笔亏损的幅度。
可以考虑加入更多过滤指标,识别一些特殊的个股现象,以减少误信号的概率。例如引入量价背离指标等。
应持续回测和验证策略参数,根据市场环境的变化及时进行参数调整。同时也要防止过度优化的情况发生。
总结
动量趋势优化组合策略是一种中长线量化交易策略,结合动量因子和趋势过滤,对T+1交易进行了专门优化。从回测指标看,策略整体效果显著,具有非常惊人的Alpha。但也应关注可能的风险,并及时根据市场环境进行参数调整。该策略可为量化交易者带来额外的Alpha,值得进一步研究和验证。
/*backtest
start: 2024-01-06 00:00:00
end: 2024-02-05 00:00:00
period: 1h
basePeriod: 15m
exchanges: [{"eid":"Futures_Binance","currency":"BTC_USDT"}]
*/

// This source code is subject to the terms of the Mozilla Public License 2.0 at https://mozilla.org/MPL/2.0/
// © fzj20020403

////@version=5
//@version=5
strategy("Optimized Zhaocaijinbao", overlay=true, margin_long=100, margin_short=0, default_qty_type=strategy.percent_of_equity, default_qty_value=100)

// Define two moving averages
ma6 = ta.sma(close, 6)
ma35 = ta.sma(close, 35)

// Define buy and sell signal lines
buyLine = ta.ema(close, 2)
sellSlope = (close - close[8]) / 8
sellLine = sellSlope * 1 + ta.sma(close, 8)

// Define volume indicator
volumeEMA = ta.ema(volume, 20)

// Define weekly slope factor
weeklyMa = ta.sma(close, 50)
weeklySlope = (weeklyMa - weeklyMa[4]) / 4 > 0

// Generate buy and sell signals
buySignal = ta.crossover(buyLine, sellLine) and close > ma35 and volume > volumeEMA and weeklySlope
sellSignal = ta.crossunder(sellLine, buyLine)

// Define dynamic position sizing factor
equity = strategy.equity
maxPositionSize = equity * input.float(title='Max Position Size (%)', defval=0.01, minval=0.001, maxval=0.5, step=0.001)
riskFactor = input.float(title='Risk Factor', defval=2.0, minval=0.1, maxval=10.0, step=0.1)
atr = ta.atr(14)
positionSize = maxPositionSize * riskFactor / atr

// Define position status
var inPosition = false

// Define buy and sell conditions
buyCondition = buySignal and not inPosition
sellCondition = sellSignal and inPosition

// Perform buy and sell operations
if (buyCondition)
    strategy.entry("Long", strategy.long, qty=positionSize)
    inPosition := true
if (sellCondition)
    strategy.close("Long")
    inPosition := false

// Draw vertical line markers for buy and sell signals
plotshape(buyCondition, style=shape.arrowdown, location=location.belowbar, color=color.green, size=size.small)
plotshape(sellCondition, style=shape.arrowup, location=location.abovebar, color=color.red, size=size.small)

// Draw two moving averages
plot(ma6, color=color.blue)
plot(ma35, color=color.orange)

// Draw volume indicator line
plot(volumeEMA, color=color.yellow)

// Define stop loss and take profit
stopLoss = strategy.position_avg_price * 0.5
takeProfit = strategy.position_avg_price * 1.25

if inPosition
    strategy.exit("Long Stop Loss", "Long", stop=stopLoss)
    strategy.exit("Long Take Profit", "Long", limit=takeProfit)