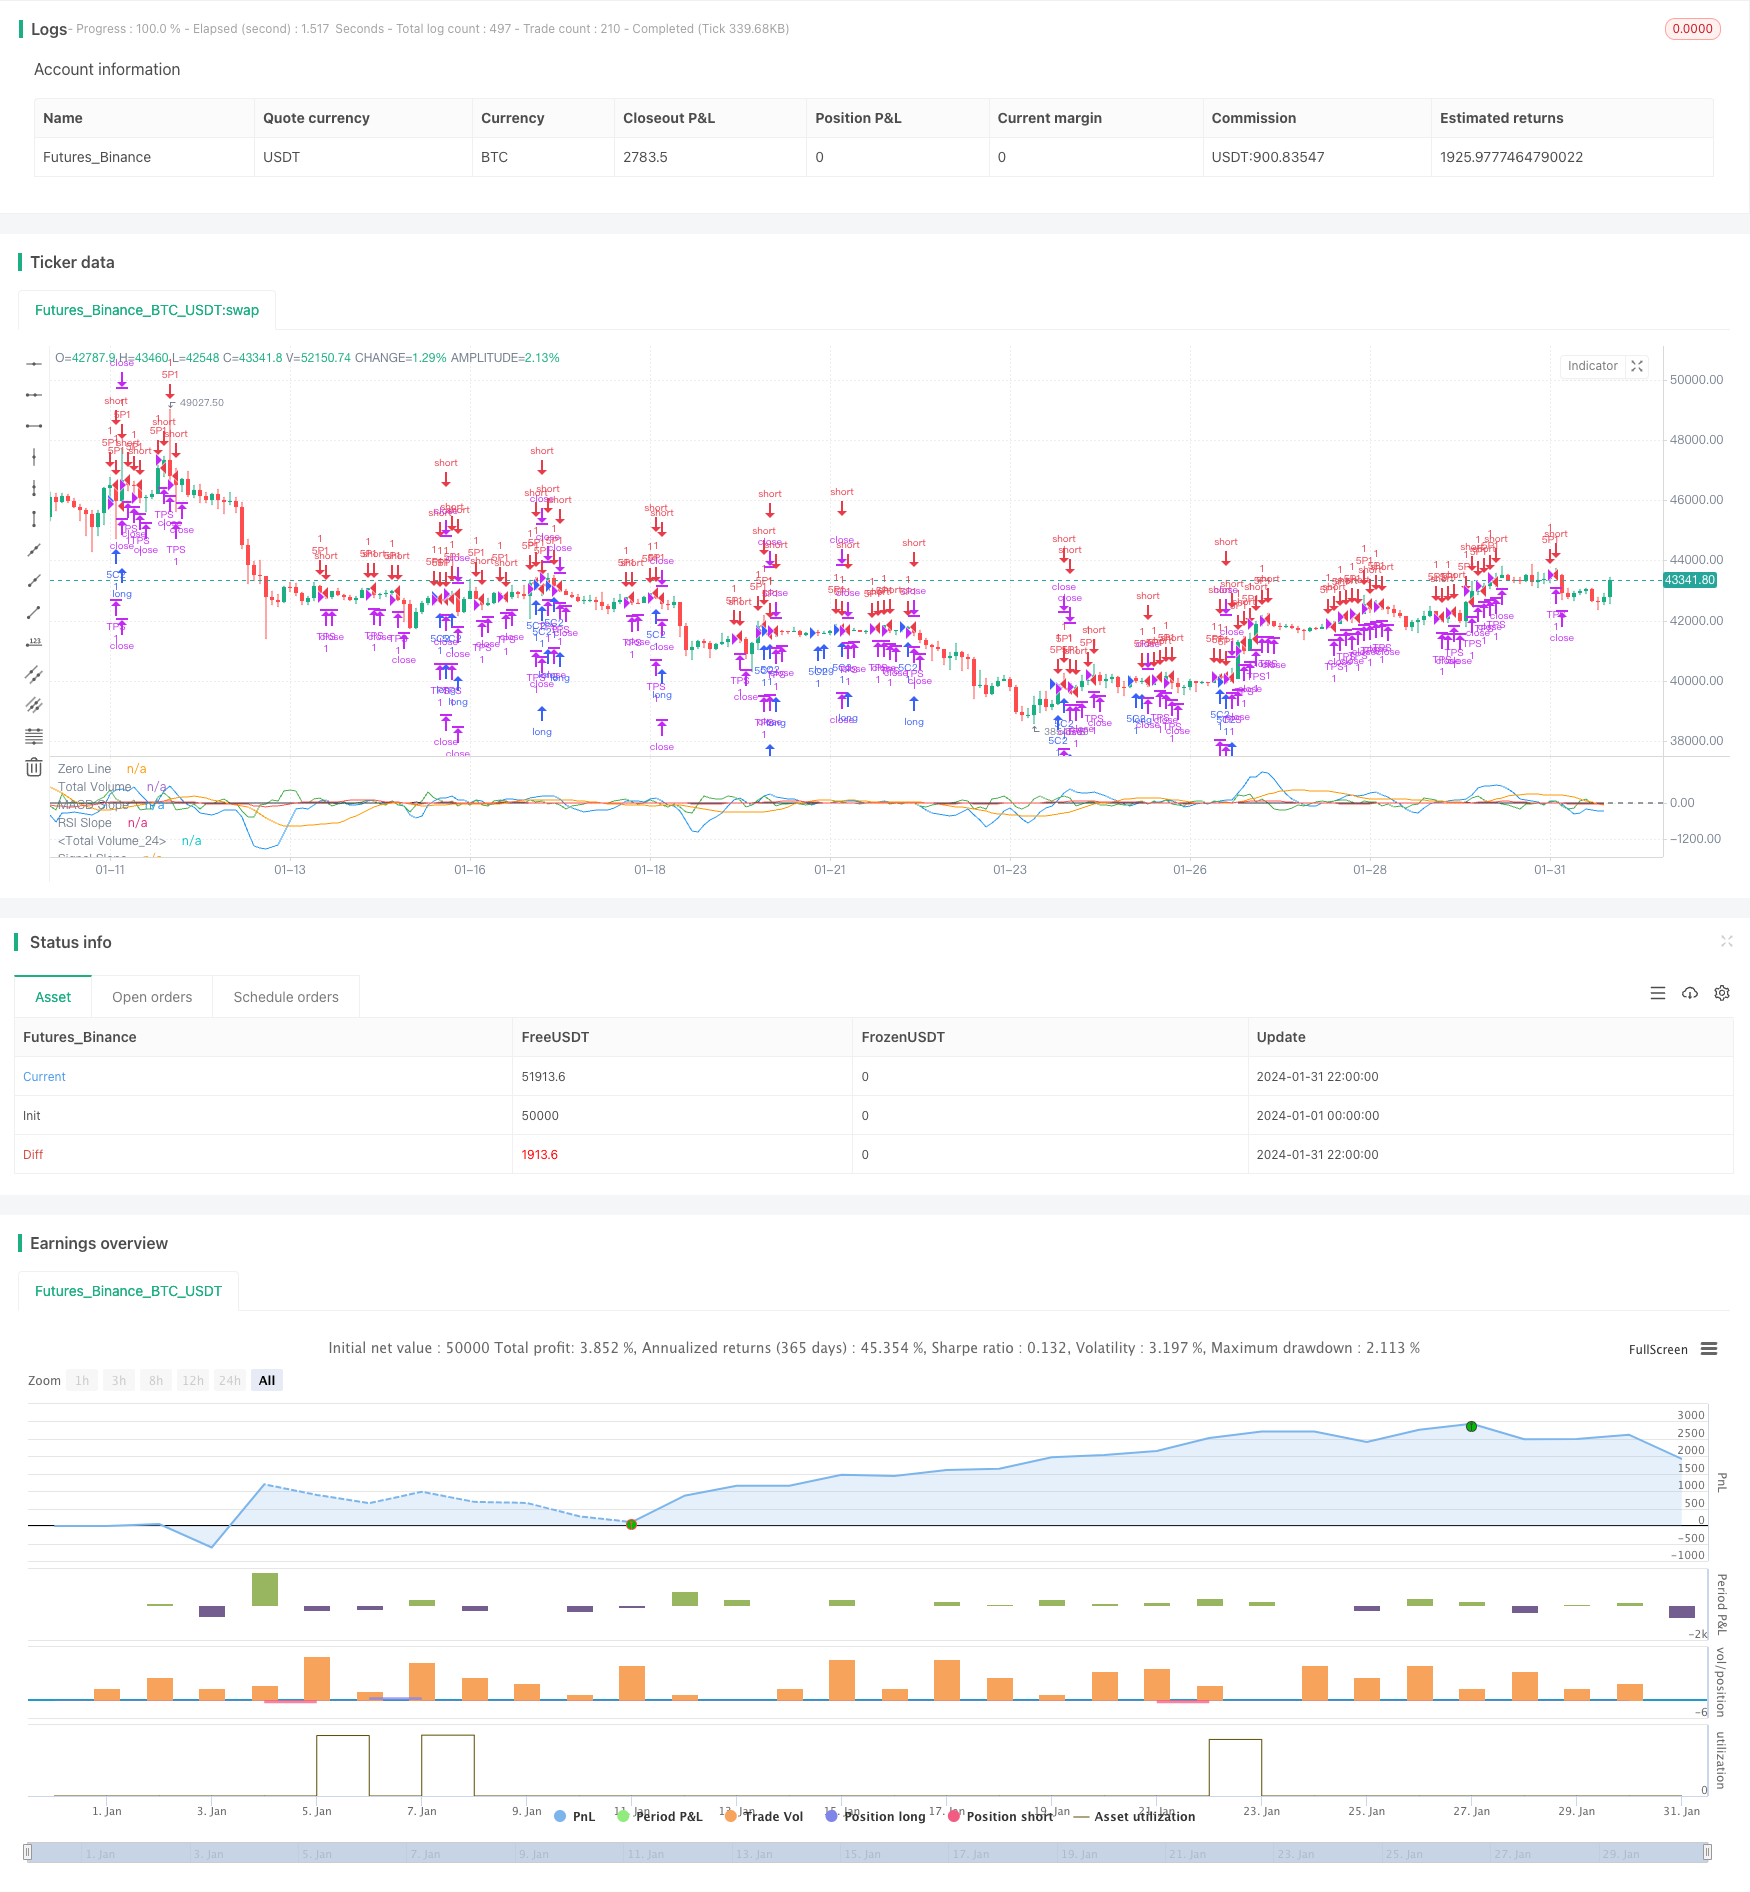
概述
该策略采用3日快速移动平均线、10日慢速移动平均线和16日信号平滑移动平均线构建MACD指标,辅以RSI指标和成交量特征,设定多维K线特征,判断行情过度了结,形成区间震荡趋势,以反转 Entries获利。
策略原理
代码主要运用3日快速移动平均线减10日慢速移动平均线形成 MACD 指标,16日信号线平滑处理,形成标准MACD策略。同时结合成交量分析买入和卖出量,判断力量特征。还引入RSI指标判断超买超卖。通过多指标复合,判断行情特征,发现interval震荡趋势的变化,构建Entry信号。
具体来说,通过观察MACD线与信号线的关系、斜率的变化,判断多空势力的消长,寻找反转机会。同时,成交量的买卖量变化也反映了多空力量的消长。结合RSI指标的变化判断超买超卖现象,综合这些指标,我们可以判断行情的局部特征以及可能发生反转的时机。
本策略共设置了3个Entry信号:
当成交量没有买入量优势,RSI低于41并且上涨,MACD信号无明显偏离时,做多;
当成交量有买入量优势,RSI在45-55区间并且上涨,MACD和信号线同向上时,做多;
当MACD高于设置阈值且上涨时,做空。
这3种情况都反映了行情短期内的区域震荡和向一方向的过度扩张,因此判断为反转的良好时点,采取反向操作。
Exit设置为止损和止盈方式,回撤控制和获利兑现。
优势分析
该策略结合多种指标判断震荡区间和超买超卖现象,反转获利思路清晰。运用成交量分析比较深入,增加了操作依据。止损止盈设置也较为谨慎,避免过度追涨杀跌。
具体来说,优势有:
MACD作为一个量价测试指标,判断价格与成交量的关系,避免单一技术面分析的主观;
成交量状况判断多空力量,增加 Entries 确认;
RSI判断超买超卖,辅助寻找反转;
止损止盈设置防止过度损失,锁定部分利润。
风险分析
尽管该策略综合运用多指标增加胜率,但任何策略都难免存在一定风险,主要问题在于:
指标发出虚假信号的概率,如反转后继续原趋势运行;
止损止盈设定不当,存在回撤过大和利润不能很好锁定的可能;
参数设置可能需要进一步测试优化,如均线参数组合、RSI周期、止损止盈倍数等。
这些风险都是可以通过进一步优化来降低。具体方法将在下一部分展开描述。
优化方向
该策略仍有进一步优化的空间,主要方向集中在以下几个方面:
测试不同均线参数设置,寻找最佳组合;
测试RSI参数设置,确定一个更合适判断超买超卖的周期;
优化止损止盈倍数,在最大回撤和利润锁定间找到平衡;
引入机器学习模型,利用更大数据训练,减少误判概率,提高胜率。
这些优化手段都是可以通过更系统的回测来实现。随着参数空间测试的扩大和样本量的增长,策略的胜率和盈利指标也会不断提高。
总结
本策略综合运用MACD、RSI和成交量三大类指标,判断行情区间震荡特征,在反转点设立Entries,以套取反弹增量为目标。策略思路清晰,兼顾趋势和反转,在优化后具有良好的盈利空间。通过参数调整和模型引入,预计可成为高效稳定的量化策略。
/*backtest
start: 2024-01-01 00:00:00
end: 2024-01-31 23:59:59
period: 2h
basePeriod: 15m
exchanges: [{"eid":"Futures_Binance","currency":"BTC_USDT"}]
*/

//@version=5
strategy("3 1 Oscillator Profile Flagging", shorttitle="3 1 Oscillator Profile Flagging", overlay=false)

signalBiasValue = input(title="Signal Bias", defval=0.26)
macdBiasValue = input(title="MACD Bias", defval=0.7)
shortLookBack = input( title="Short LookBack", defval=3)
longLookBack = input( title="Long LookBack", defval=6)
takeProfit = input( title="Take Profit", defval=2)
stopLoss = input( title="Stop Loss", defval=0.7)

fast_ma = ta.sma(close, 3)
slow_ma = ta.sma(close, 10)
macd = fast_ma - slow_ma
signal = ta.sma(macd, 16)
hline(0, "Zero Line", color = color.black)

buyVolume = volume*((close-low)/(high-low))
sellVolume = volume*((high-close)/(high-low))
buyVolSlope = buyVolume - buyVolume[1]
sellVolSlope = sellVolume - sellVolume[1]
signalSlope = ( signal - signal[1] )
macdSlope = ( macd - macd[1] )
plot(macd, color=color.blue, title="Total Volume")
plot(signal, color=color.orange, title="Total Volume")
plot(macdSlope, color=color.green, title="MACD Slope")
plot(signalSlope, color=color.red, title="Signal Slope")
intrabarRange = high - low
rsi = ta.rsi(close, 14)
rsiSlope = rsi - rsi[1]
plot(rsiSlope, color=color.black, title="RSI Slope")

getRSISlopeChange(lookBack) =>
    j = 0
    for i = 0 to lookBack
        if ( rsi[i] - rsi[ i + 1 ] ) > -5
            j += 1
    j

getBuyerVolBias(lookBack) =>
    j = 0
    for i = 1 to lookBack
        if buyVolume[i] > sellVolume[i]
            j += 1
    j

getSellerVolBias(lookBack) =>
    j = 0
    for i = 1 to lookBack
        if sellVolume[i] > buyVolume[i]
            j += 1
    j

getVolBias(lookBack) =>
    float b = 0.0
    float s = 0.0
    for i = 1 to lookBack
        b += buyVolume[i]
        s += sellVolume[i]
    b > s

getSignalBuyerBias(lookBack) =>
    j = 0
    for i = 1 to lookBack
        if signal[i] > signalBiasValue
            j += 1
    j

getSignalSellerBias(lookBack) =>
    j = 0
    for i = 1 to lookBack
        if signal[i] < ( 0.0 - signalBiasValue )
            j += 1
    j

getSignalNoBias(lookBack) =>
    j = 0
    for i = 1 to lookBack
        if signal[i] < signalBiasValue and signal[i] > ( 0.0 - signalBiasValue )
            j += 1
    j

getPriceRising(lookBack) =>
    j = 0
    for i = 1 to lookBack
        if close[i] > close[i + 1]
            j += 1
    j


getPriceFalling(lookBack) =>
    j = 0
    for i = 1 to lookBack
        if close[i] < close[i + 1]
            j += 1
    j

getRangeNarrowing(lookBack) =>
    j = 0
    for i = 1 to lookBack
        if intrabarRange[i] < intrabarRange[i + 1]
            j+= 1
    j

getRangeBroadening(lookBack) =>
    j = 0
    for i = 1 to lookBack
        if intrabarRange[i] > intrabarRange[i + 1]
            j+= 1
    j

bool isNegativeSignalReversal = signalSlope < 0.0 and signalSlope[1] > 0.0
bool isNegativeMacdReversal = macdSlope < 0.0 and macdSlope[1] > 0.0

bool isPositiveSignalReversal = signalSlope > 0.0 and signalSlope[1] < 0.0
bool isPositiveMacdReversal = macdSlope > 0.0 and macdSlope[1] < 0.0

bool hasBearInversion = signalSlope > 0.0 and macdSlope < 0.0
bool hasBullInversion = signalSlope < 0.0 and macdSlope > 0.0

bool hasSignalBias = math.abs(signal) >= signalBiasValue
bool hasNoSignalBias = signal < signalBiasValue and signal > ( 0.0 - signalBiasValue )

bool hasSignalBuyerBias = hasSignalBias and signal > 0.0
bool hasSignalSellerBias = hasSignalBias and signal < 0.0

bool hasPositiveMACDBias = macd > macdBiasValue
bool hasNegativeMACDBias = macd < ( 0.0 - macdBiasValue )

bool hasBullAntiPattern = ta.crossunder(macd, signal)
bool hasBearAntiPattern = ta.crossover(macd, signal)

bool hasSignificantBuyerVolBias = buyVolume > ( sellVolume * 1.5 )
bool hasSignificantSellerVolBias = sellVolume > ( buyVolume * 1.5 )


// 202.30 Profit 55.29% 5m
if ( ( getVolBias(longLookBack) == false ) and rsi <= 41 and math.abs(rsi - rsi[shortLookBack]) > 1 and hasNoSignalBias and rsiSlope > 1.5 and close > open)
    strategy.entry("5C1", strategy.long, qty=1)
strategy.exit("TPS", "5C1", limit=strategy.position_avg_price + takeProfit, stop=strategy.position_avg_price - stopLoss)

// 171.70 Profit 50.22% 5m
if ( getVolBias(longLookBack) == true and rsi > 45 and rsi < 55 and macdSlope > 0 and signalSlope > 0)
    strategy.entry("5C2", strategy.long, qty=1)
strategy.exit("TPS", "5C2", limit=strategy.position_avg_price + takeProfit, stop=strategy.position_avg_price - stopLoss)

// 309.50 Profit 30.8% 5m 2 tp .7 sl 289 trades
if ( macd > macdBiasValue and macdSlope > 0)
    strategy.entry("5P1", strategy.short, qty=1)
strategy.exit("TPS", "5P1", limit=strategy.position_avg_price - takeProfit, stop=strategy.position_avg_price + stopLoss)