本策略是一款创新的综合多空自动期货交易策略,整合SuperTrend、QQE和Trend Indicator A-V2多个指标,实现自动发现交易讯号并进行多空交易。本策略旨在发掘市场主要趋势,在控制好风险的前提下获得稳定收益。
策略原理
本策略主要基于三个部分:
SuperTrend指标负责判断市场主要趋势方向。当价格超过上转向线时为看涨,下破下转向线时为看跌。
QQE指标结合RSI判断超买超卖状态。根据RSI的平均值、标准差计算出动态上下限,RSI高于上限时为超买讯号,低于下限时为超卖讯号。
Trend Indicator A-V2指标通过计算EMA快慢线位置判断趋势,快线高于慢线为看涨讯号。
在判断市场方向时,当SuperTrend为看涨,且QQE判断非超卖,且A-V2为看涨时,发出做多讯号进场;当SuperTrend为看跌,且QQE判断非超买,且A-V2为看跌时,发出做空讯号进场。
策略优势
综合使用多个指标,使交易决策更加可靠,减少假讯号。
可实现自动发现交易讯号,无需人工干预判断,降低人为错误。
利用指标有机结合,在发现讯号的同时控制好风险,达到稳定盈利。
参数可调,用户可根据自己偏好个性化策略。
支持单边多单或双边交易,交易灵活。
风险及解决
市场特殊情况下,指标可能发出错误讯号,可通过优化指标参数减少。
交易成本和滑点可能影响策略盈利空间,可通过实现止损止盈机制优化。
指标参数设定不当可能导致策略表现不佳,可尝试不同参数寻找最佳配置。
优化方向
增加机器学习算法,根据历史数据自动优化指标参数,使策略更加智能化。
结合更多市场微结构因素,如交易量、外盘等数据发掘更有效的交易讯号。
应用高频交易技术,通过算法模型自动提交订单进行交易执行。
总结
本策略整合多个指标判断市场结构,在控制风险的前提下实现稳定盈利,既考虑趋势方向又兼顾超买超卖状态,交易决策更加细緻。优化空间还很大,可从参数优化、结构优化、执行优化等方面进一步提升策略表现。
/*backtest
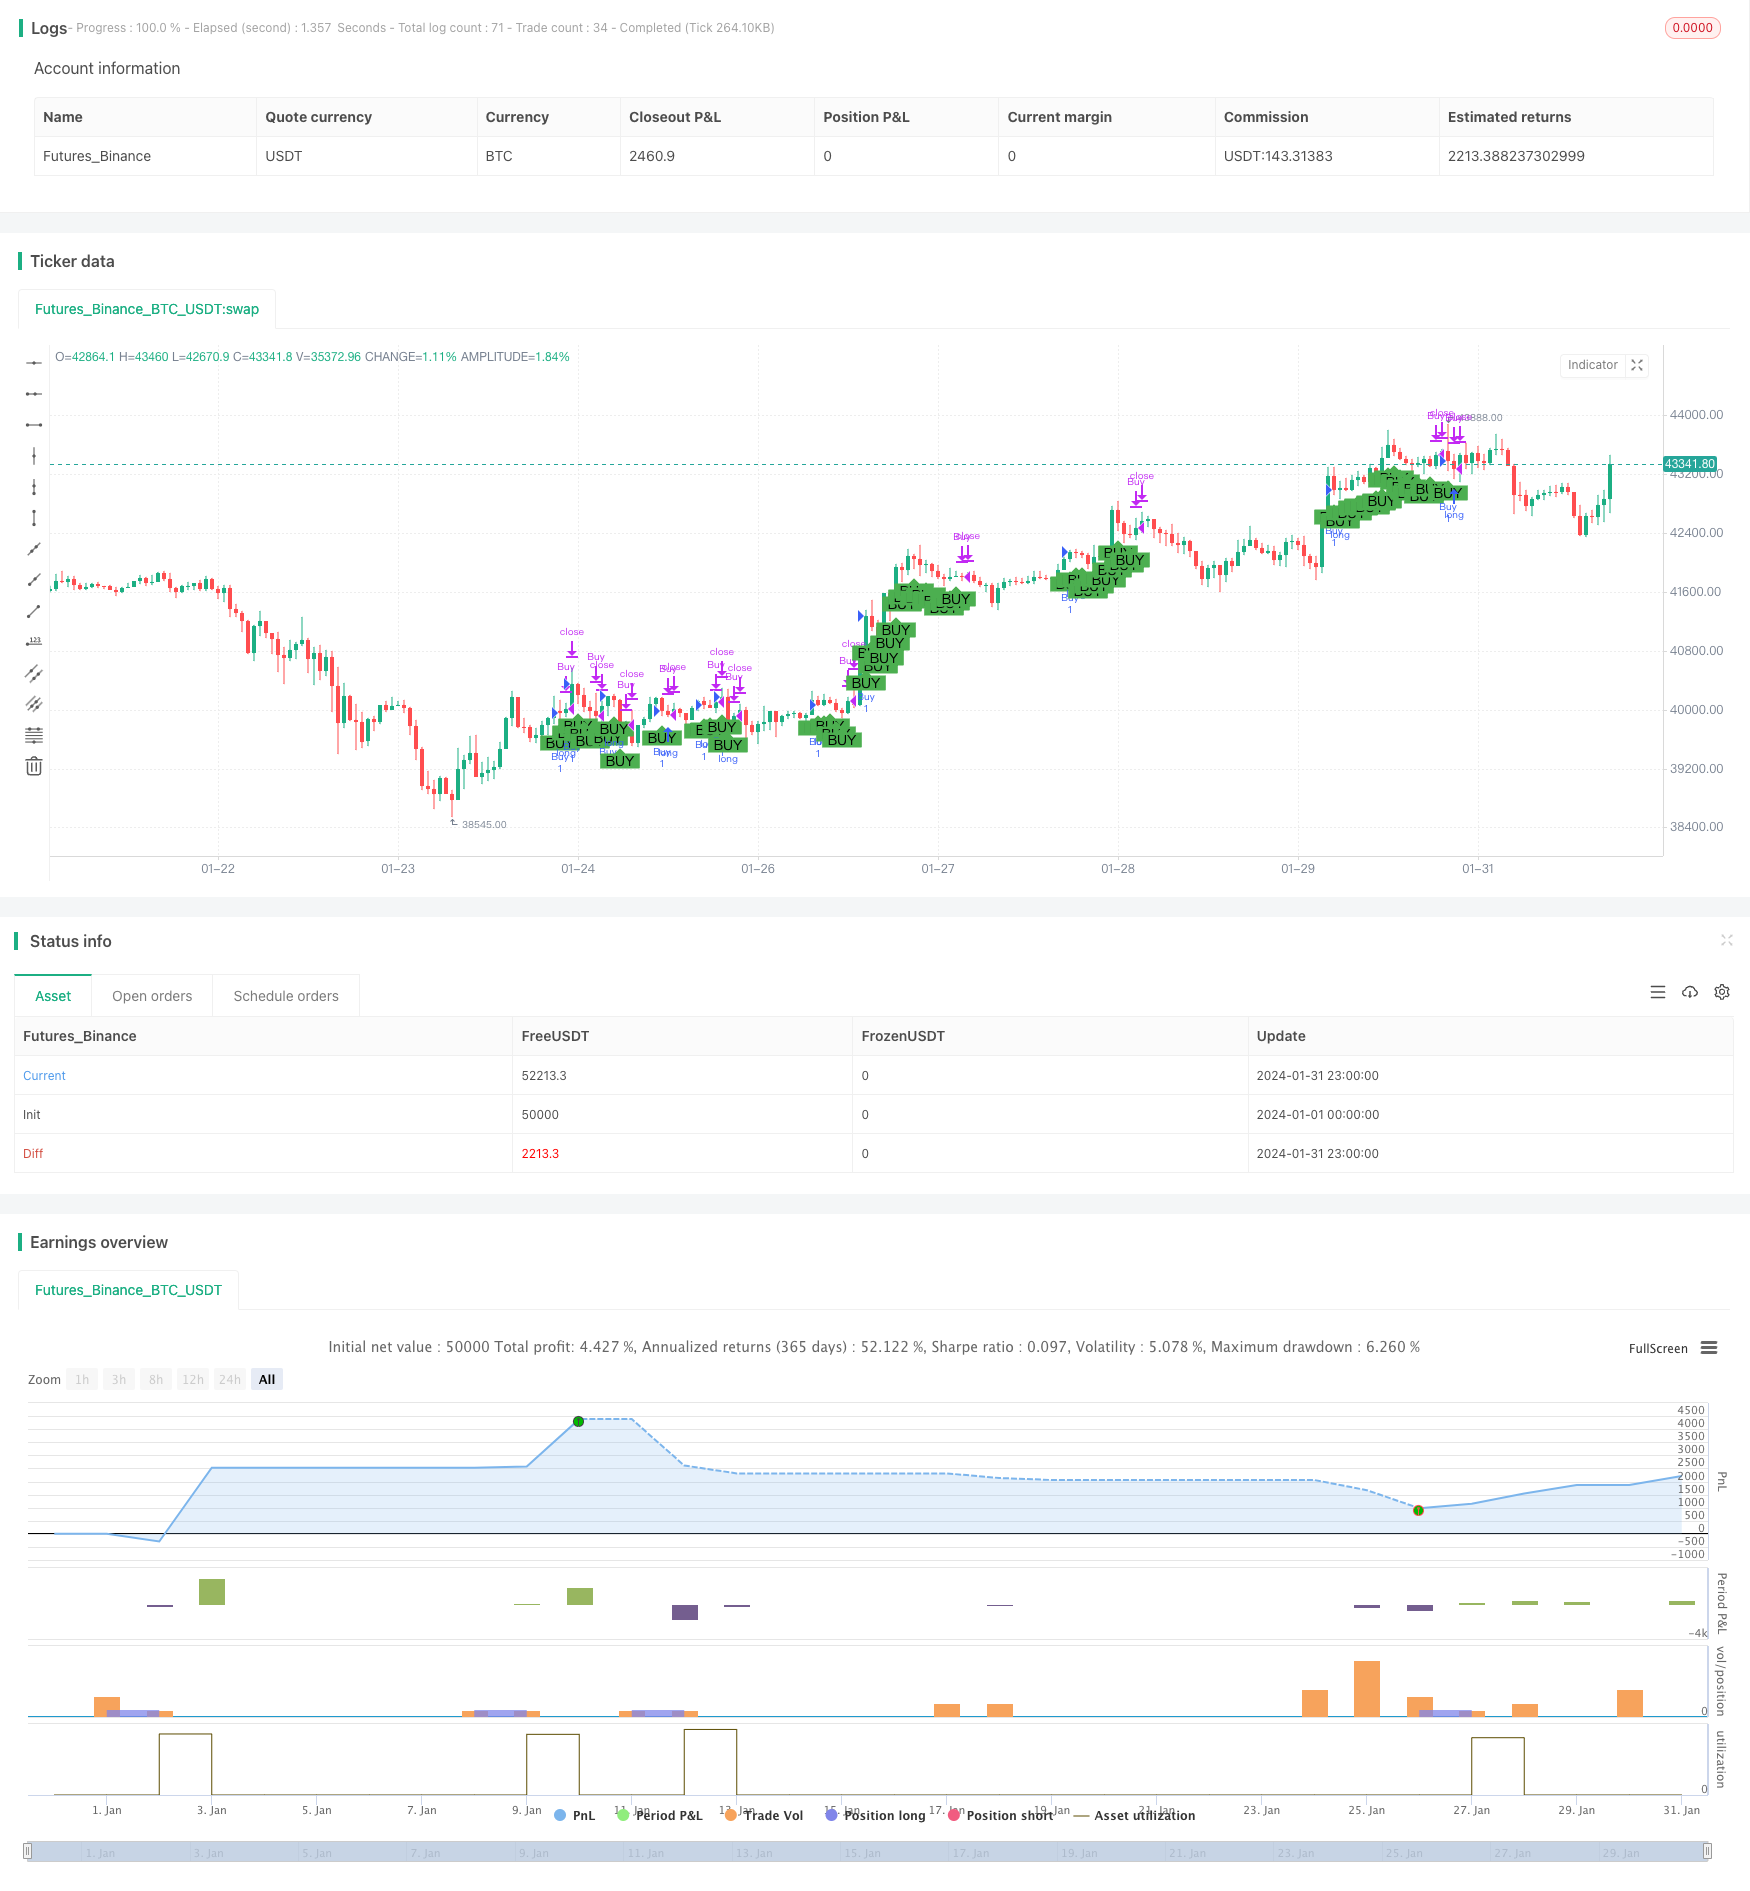
start: 2024-01-01 00:00:00
end: 2024-01-31 23:59:59
period: 1h
basePeriod: 15m
exchanges: [{"eid":"Futures_Binance","currency":"BTC_USDT"}]
*/
//@version=4
//author:盧振興 芙蓉中華中學畢業 育達科技大學畢業碩士
//參考資料 : QQE MOD By:Mihkel00 ,SuperTrend By:KivancOzbilgic , TrendIndicator A-V2 By:Dziwne
strategy("綜合交易策略", shorttitle="Comprehensive Strategy", overlay=true)
// 添加單邊或多空參數
OnlyLong = input(true, title="單邊")
// SuperTrend 参数
PeriodsST = input(9, title="ST ATR Period")
MultiplierST = input(3.9, title="ST ATR Multiplier")
srcST = input(hl2, title="ST Source")
atrST = atr(PeriodsST)
upST = srcST - (MultiplierST * atrST)
upST := close[2] > upST[1] ? max(upST, upST[1]) : upST
dnST = srcST + (MultiplierST * atrST)
dnST := close[2] < dnST[1] ? min(dnST, dnST[1]) : dnST
trendST = 1
trendST := nz(trendST[1], trendST)
trendST := trendST == -1 and close[2] > dnST[1] ? 1 : trendST == 1 and close[2] < upST[1] ? -1 : trendST
// QQE 参数
RSI_PeriodQQE = input(6, title='QQE RSI Length')
SFQQE = input(5, title='QQE RSI Smoothing')
QQE = input(3, title='QQE Fast Factor')
ThreshHoldQQE = input(3, title="QQE Thresh-hold")
srcQQE = input(close, title="QQE RSI Source")
Wilders_PeriodQQE = RSI_PeriodQQE * 2 - 1
RsiQQE = rsi(srcQQE, RSI_PeriodQQE)
RsiMaQQE = ema(RsiQQE, SFQQE)
AtrRsiQQE = abs(RsiMaQQE[1] - RsiMaQQE)
MaAtrRsiQQE = ema(AtrRsiQQE, Wilders_PeriodQQE)
darQQE = ema(MaAtrRsiQQE, Wilders_PeriodQQE) * QQE
basisQQE = sma(RsiMaQQE - 50, 50)
devQQE = 0.35 * stdev(RsiMaQQE - 50, 50)
upperQQE = basisQQE + devQQE
lowerQQE = basisQQE - devQQE
qqeCondition = RsiMaQQE[1] - 50 > upperQQE[1] ? true : RsiMaQQE[1] - 50 < lowerQQE[1] ? false : na
// Trend Indicator A-V2 参数
ma_periodA_V2 = input(52, title="TIA-V2 EMA Period")
oA_V2 = ema(open, ma_periodA_V2)
cA_V2 = ema(close, ma_periodA_V2)
trendIndicatorAV2Condition = cA_V2[1] >= oA_V2[1] ? true : false
// 综合交易逻辑
longCondition = trendST == 1 and qqeCondition and trendIndicatorAV2Condition
shortCondition = trendST == -1 and not qqeCondition and not trendIndicatorAV2Condition
// 针对多单的开平仓逻辑
if (OnlyLong)
if (longCondition)
strategy.entry("Buy", strategy.long)
else
strategy.close("Buy")
// 多空都做时的逻辑
if (not OnlyLong)
if (longCondition)
strategy.entry("Buy", strategy.long)
else if (shortCondition)
strategy.entry("Sell",strategy.short)
// 添加多空平仓逻辑
if (not longCondition)
strategy.close("Buy")
if (not shortCondition)
strategy.close("Sell")
// 可视化信号
plotshape(series=longCondition, title="Buy Signal", location=location.belowbar, color=color.green, style=shape.labelup, text="BUY")
plotshape(series=shortCondition and not OnlyLong, title="Sell Signal", location=location.abovebar, color=color.red, style=shape.labeldown, text="SELL")