概述
双均线黄金交叉趋势追踪策略通过计算价格的双均线(DEMA和TEMA),并检测其交叉形成黄金交叉信号,来判断市场总体走势和发出交易信号。该策略结合趋势指标和突破信号,旨在追踪中长线趋势,在趋势开始阶段就能捕捉到信号。
策略原理
该策略的核心指标是长度为200的DEMA和长度为9和50的两个TEMA。DEMA作为判断总体趋势的指标,两个TEMA的交叉作为产生买卖信号的指标。
当短期9周期TEMA上穿中期50周期TEMA时,产生买入信号,表示短期上升趋势开始,可以买入;当短期9周期TEMA下穿中期50周期TEMA时,产生卖出信号,表示短期下跌趋势开始,可以卖出。
为过滤假突破,该策略增加了DEMA指标的判断,只有当价格高于DEMA时,TEMA交叉的信号才有效,这样可以在趋势开始时就捕捉到信号。
优势分析
该策略结合均线判断趋势和均线交叉判断信号的优点,既考虑了短期和中期两个时间维度的信息,又同时判断了两种不同类型的技术指标信号,从而提高了信号的可靠性,减少了噪音和假信号。
在判断信号的有效性时加入DEMA指标作为过滤器,可以避免在盘整和无明显趋势时依然产生信号导致不必要的头寸。这大大减少了损失的风险。
风险分析
由于该策略采用了较为稳定的参数设置,长期测试表现良好,但在特定市场环境下仍存在一定风险:
市场出现剧烈波动时,均线交叉信号可能滞后,无法及时反映价格变动。此时会错过最佳入场时机或止损点。
当趋势反转时,由于DEMA指标设置较长,可能无法及时转换信号判断。这会导致亏损放大。
由于基于均线指标和趋势判断,所以该策略更适合中长线操作。短线操作时,存在获利不足的风险。
优化方向
该策略可以从以下几个方面进一步优化:
优化DEMA和TEMA的参数,使其更好地适应不同品种和市场环境。可以测试更多组合,找到最佳参数。
增加由其他指标组成的过滤器和确认机制,例如交易量,波动率等指标,进一步提高信号质量。
增加止损機制,当价格突破DEMA时止损。这可以减少损失。
优化止损和止盈点设置,使其更加适应市场的平均波动范围。
总结
双均线黄金交叉趋势追踪策略综合考虑了多个时间维度的趋势判断和交叉信号,在判断信号有效性时增加过滤条件,可以有效追踪中长线趋势,及时捕捉机会,避免低效交易。该策略稳定性较好,适合多种市场环境,是一种值得长期持有使用的量化策略。未来通过参数和模块优化,可以进一步增强策略的稳定性和盈利能力。
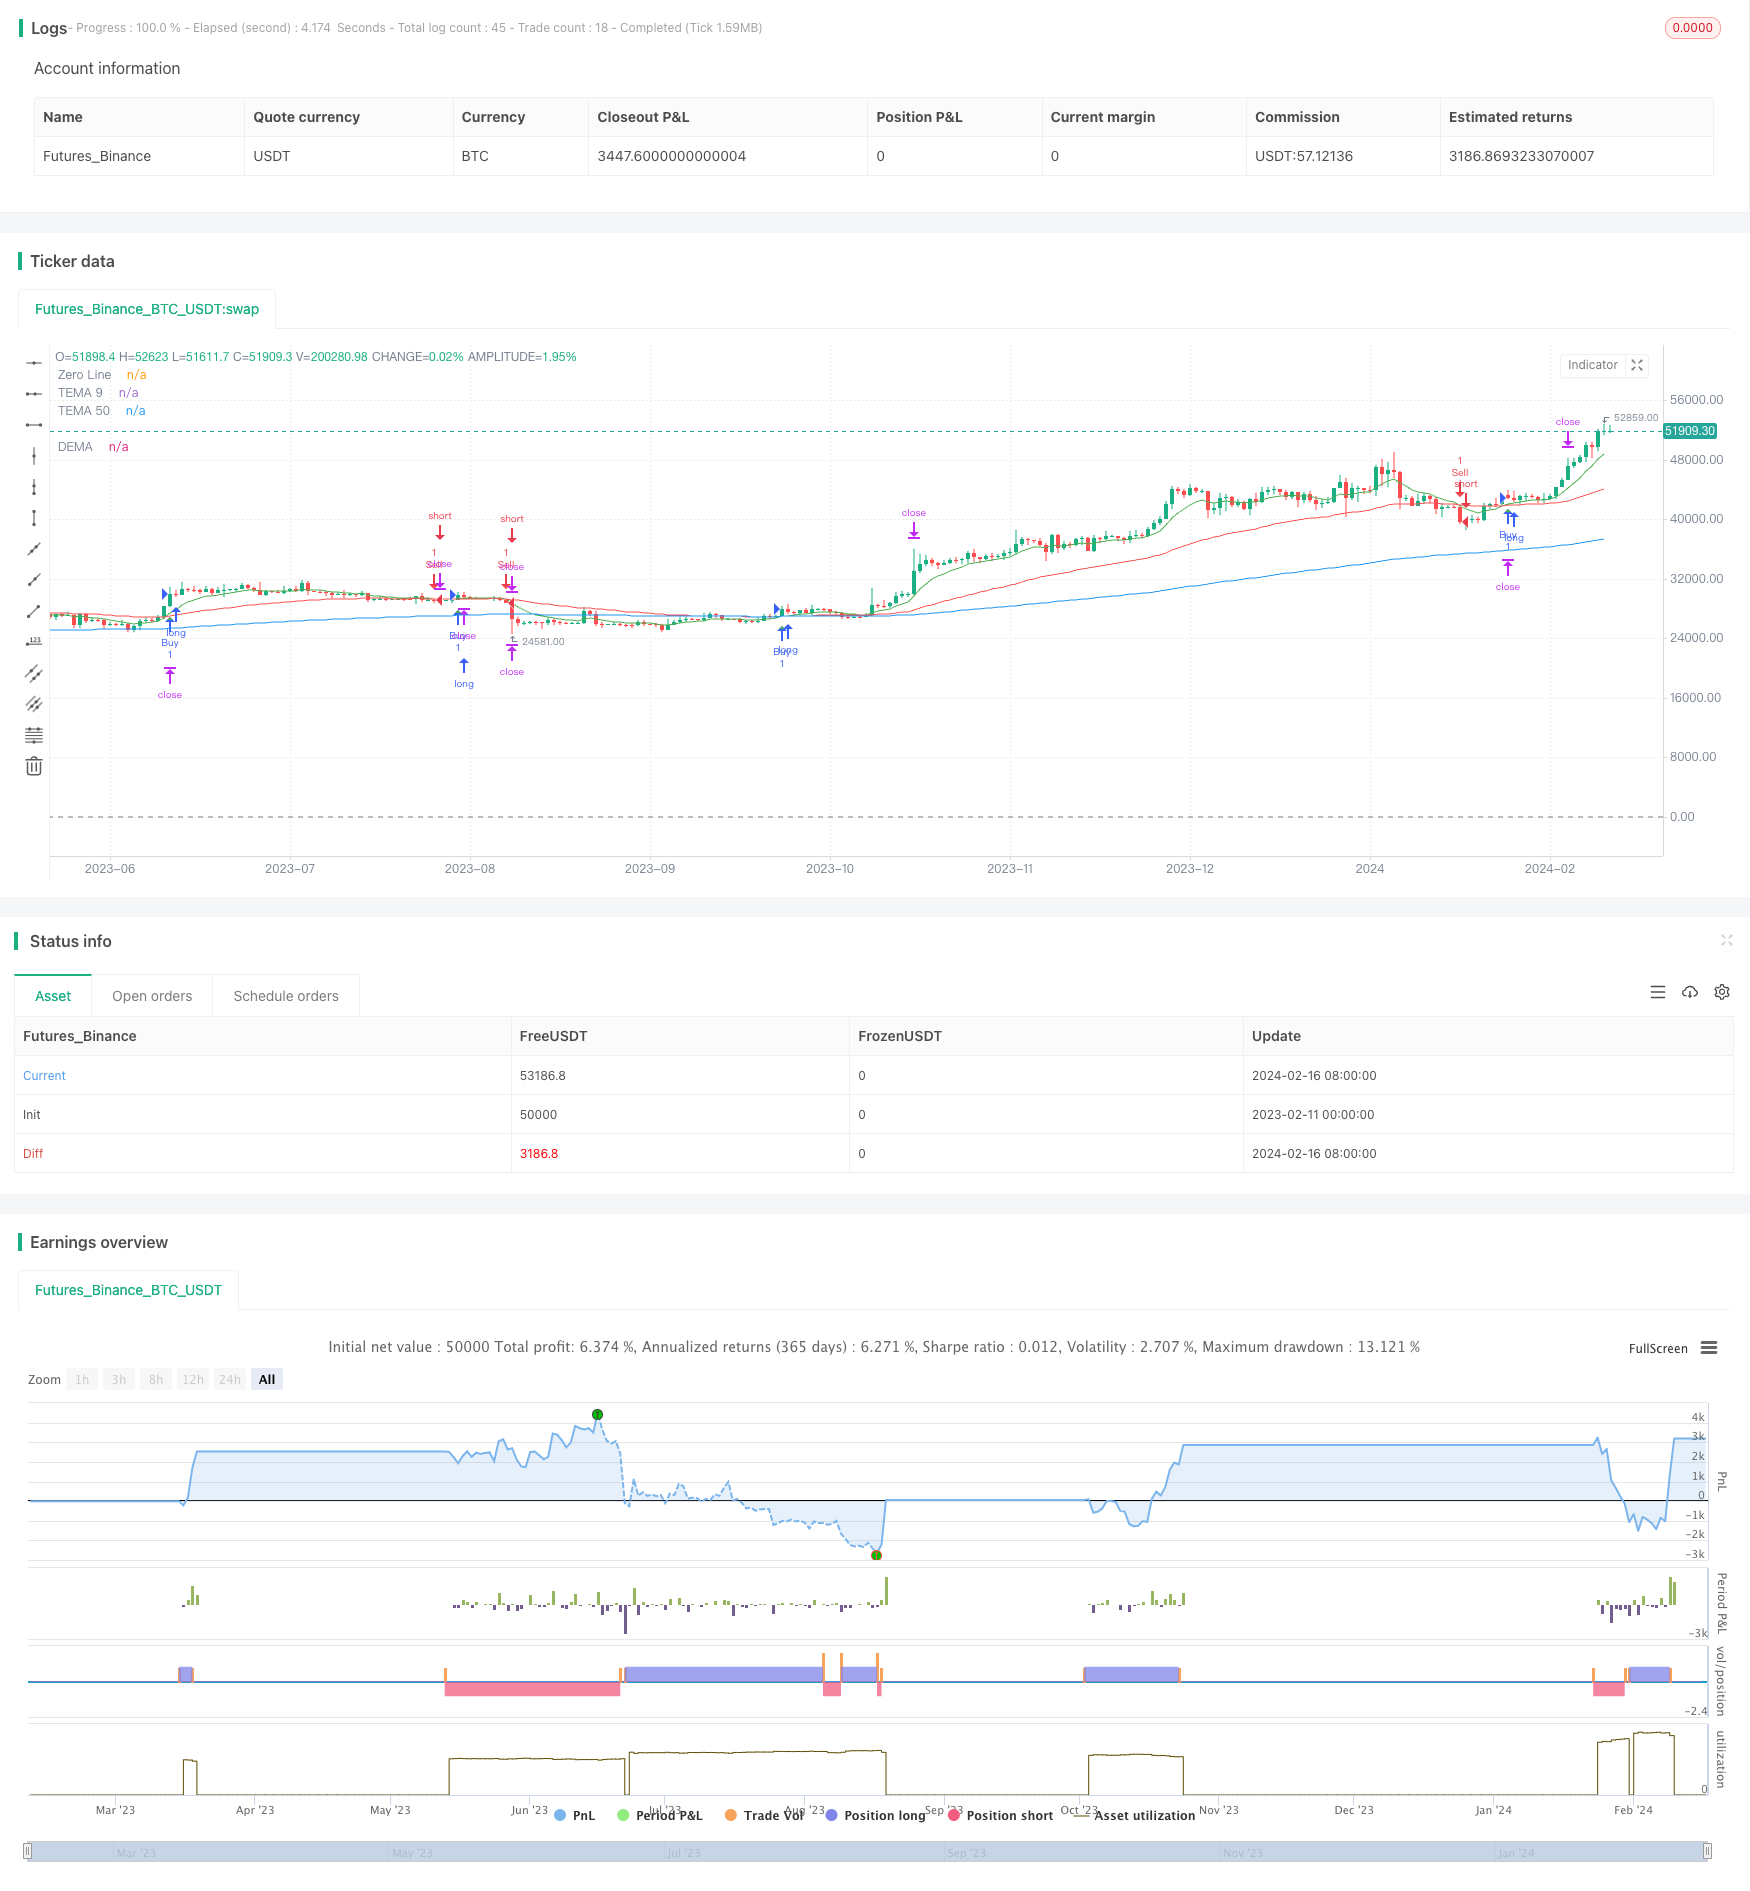
/*backtest
start: 2023-02-11 00:00:00
end: 2024-02-17 00:00:00
period: 1d
basePeriod: 1h
exchanges: [{"eid":"Futures_Binance","currency":"BTC_USDT"}]
*/

//@version=5
strategy("Estrategia de Trading", shorttitle="DEMA+TEMA", overlay=true)

// Parámetros de la estrategia
risk_percentage = input(1, title="Porcentaje de Riesgo (%)") / 100
stop_loss_pips = input(30, title="Stop Loss (pips)")
take_profit_pips = input(90, title="Take Profit (pips)")
length_DEMA = input(200, title="Longitud DEMA")
length_TEMA_9 = input(9, title="Longitud TEMA 9")
length_TEMA_50 = input(50, title="Longitud TEMA 50")

// Indicadores
dema = ta.ema(close, length_DEMA)
tema_9 = ta.ema(close, length_TEMA_9)
tema_50 = ta.ema(close, length_TEMA_50)
tema_9_50_cross_up = ta.crossover(tema_9, tema_50)
tema_9_50_cross_down = ta.crossunder(tema_9, tema_50)

// Riesgo y gestión de operaciones
risk_per_trade = strategy.equity * risk_percentage
stop_loss = close - stop_loss_pips * syminfo.mintick
take_profit = close + take_profit_pips * syminfo.mintick

// Condiciones de entrada
long_condition = close > dema and tema_9_50_cross_up
short_condition = close > dema and tema_9_50_cross_down

// Estrategia de Trading
if (long_condition)
    strategy.entry("Buy", strategy.long)
    strategy.exit("Sell", from_entry="Buy", loss=stop_loss, profit=take_profit)

if (short_condition)
    strategy.entry("Sell", strategy.short)
    strategy.exit("Cover", from_entry="Sell", loss=stop_loss, profit=take_profit)

// Líneas de visualización
hline(0, "Zero Line", color=color.gray)
plot(dema, color=color.blue, title="DEMA")
plot(tema_9, color=color.green, title="TEMA 9")
plot(tema_50, color=color.red, title="TEMA 50")

// Triángulos
plotshape(tema_9_50_cross_up, color=color.green, style=shape.triangleup, location=location.belowbar, size=size.small)
plotshape(tema_9_50_cross_down, color=color.red, style=shape.triangledown, location=location.abovebar, size=size.small)