3 10 Oscillator Profile Flagging Strategy

Overview
The 3 10 Oscillator Profile Flagging strategy generates trading signals by calculating the difference between 3-day and 10-day simple moving averages as the MACD indicator and combining volume analysis to determine the strength of buyers and sellers in the market. The strategy also incorporates confirmation of entry and exit opportunities using key price areas, volume characteristics, and MACD indicator reversals.
Strategy Principle
The core indicator of this strategy is MACD, which consists of a fast moving average line and a slow moving average line. The fast line is a 3-day simple moving average and the slow line is a 10-day simple moving average. The difference between them forms the MACD histogram. When the fast line crosses above the slow line from below, it represents strengthening buying power and generates a buy signal. Conversely, when the fast line crosses below the slow line from above, selling power is strengthening and a sell signal is generated.
In addition, the strategy incorporates analysis of the relative strength of buying and selling volume based on the size relationship between buying volume and selling volume of each candlestick. The specific method is: Buying volume = Volume x (Close - Low) ÷ (High - Low); Selling volume = Volume x (High - Close) ÷ (High - Low). If the buying volume is significantly greater than the selling volume, it means the candlestick closes with relatively strong buying power, which is a buy signal.
By combining the MACD indicator and volume analysis, the strategy can effectively determine the supply and demand relationship and the pending direction in the market. At the same time, the strategy also verifies conditions such as whether the price is in a key area, whether the MACD has an effective reversal, and whether the difference between buying and selling volume is large enough, so as to filter out some impulsive noise and ensure high-probability and high-efficiency entry.
Advantage Analysis
- Use MACD indicator to judge market pending direction
- Volume difference analysis to determine the strength of buyers and sellers
- Multi-condition screening ensures high-probability operation
- Adopt stop profit and stop loss strategy to control risks
The biggest advantage of this strategy is that it fully incorporates judgment of market supply and demand relationship. The MACD histogram can effectively determine the contrast between buying and selling power and the pending direction in the market; volume difference analysis can clearly identify the dominant power between buyers and sellers. At the same time, the strategy sets multiple conditions for review to avoid chasing rises and beating declines, ensuring a relatively high probability of profit. In addition, the built-in stop profit and stop loss mechanism of the strategy can also limit single losses.
Risk Analysis
- MACD failure risk. When the market fluctuates or consolidates in a flat pattern, the MACD may generate false signals.
- Volume failure risk. There may be market manipulation to drive up trading volume, which would reduce the accuracy of volume analysis.
- Difficulty of parameter optimization. The strategy contains multiple parameters that are difficult to optimize, making it unsuitable for investors with relatively weak parameter tuning capabilities.
The above risks can be avoided by: accurately determining the main trend of the market to avoid using this strategy during market fluctuation; paying attention to market information to identify artificially inflated trading volumes; adjusting parameters carefully, or seeking advice from professionals.
Optimization Directions
The strategy can be optimized in the following aspects:
- Use indicators like KD, Bollinger Bands etc. to replace or assist MACD and improve judgment accuracy
- Add position management mechanisms for dynamic parameter adjustment
- Optimize stop profit and stop loss points for higher single profit
- Run on multiple timeframes to improve stability
In summary, it can be seen that there is ample room for optimizing this strategy. Investors can make appropriate adjustments and improvements according to their own situation and market conditions to achieve better strategy effectiveness.
Summary
The 3 10 Oscillator Profile Flagging strategy successfully integrates the ideas of MACD analysis, volume comparison, and multi-condition filtering verification. It has strong capabilities in determining supply-demand relationships and market pending directions, while controlling risks through built-in stop profit and stop loss mechanisms. The strategy has large optimization space and broad application prospects that are worth key consideration and in-depth research for investors.
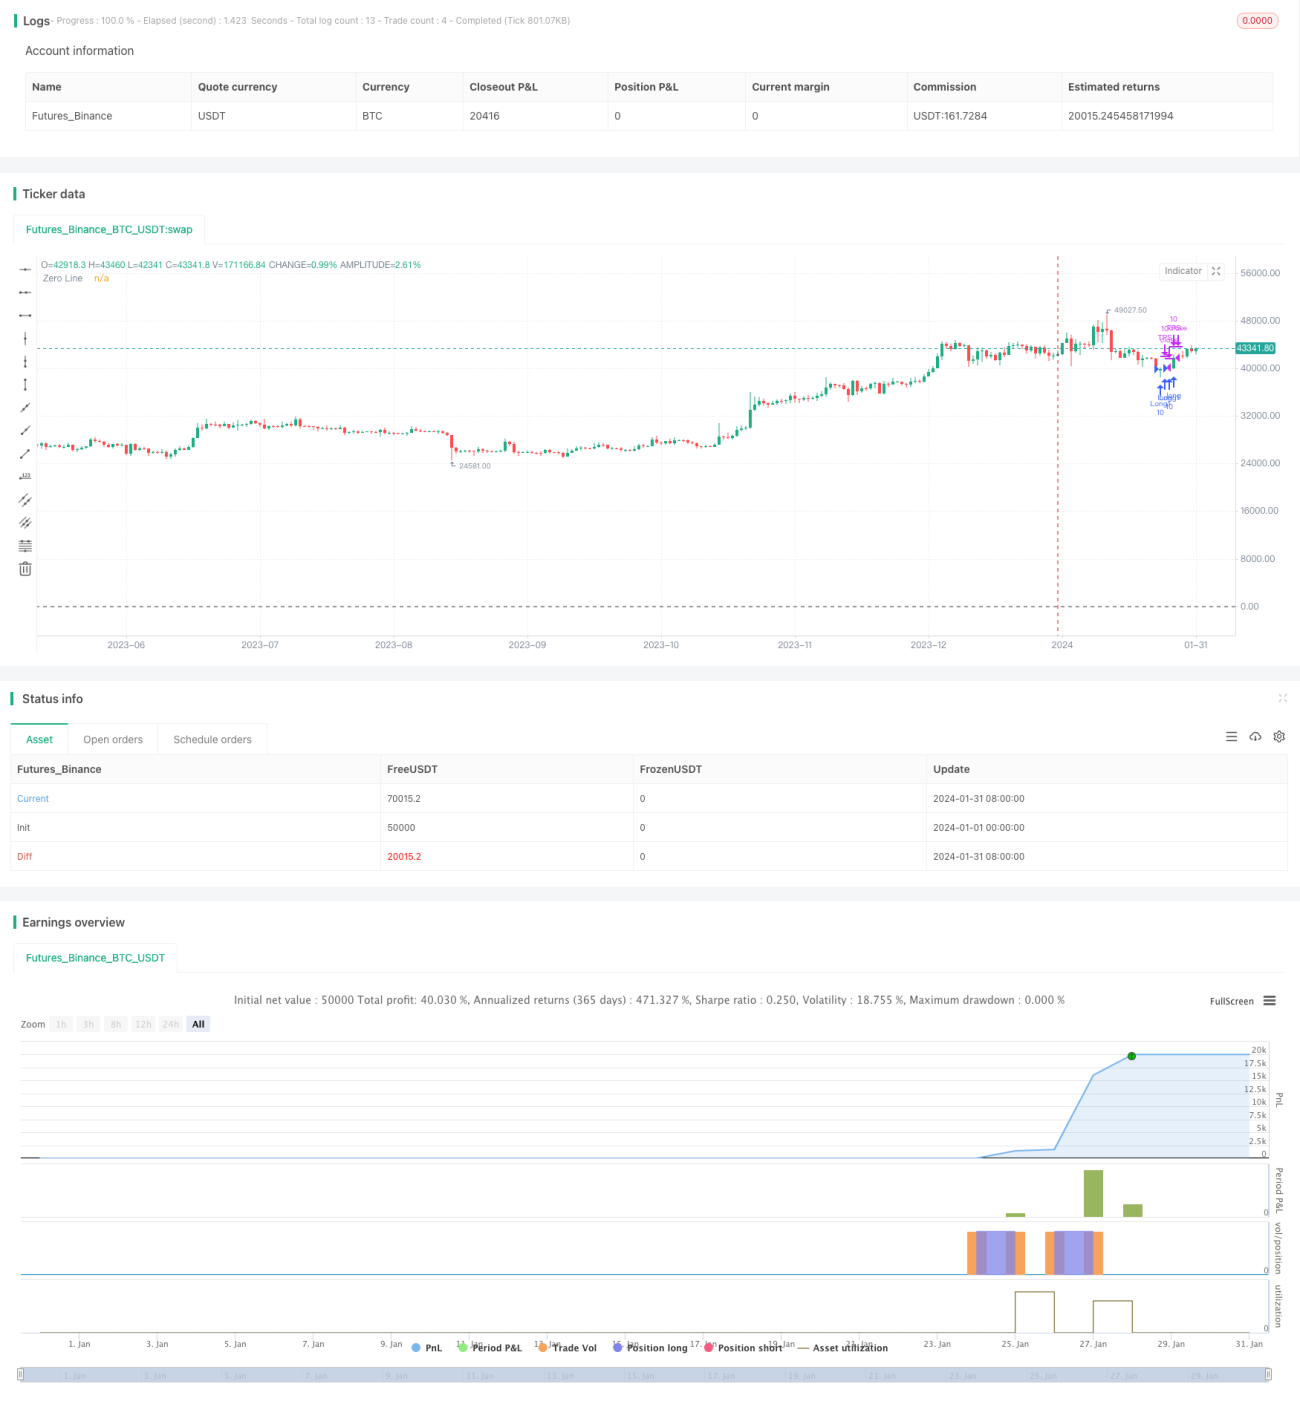
/*backtest
start: 2024-01-01 00:00:00
end: 2024-01-31 23:59:59
period: 1d
basePeriod: 1h
exchanges: [{"eid":"Futures_Binance","currency":"BTC_USDT"}]
*/

//@version=5
strategy("3 10 Oscillator Profile Flagging", shorttitle="3 10 Oscillator Profile Flagging", overlay=true)

signalBiasValue = input(title="Signal Bias", defval=0.26)- 1