Williams Double Exponential Moving Average and Ichimoku Kinkou Hyo Strategy

Overview
This strategy combines the Williams Double Exponential Moving Average and Ichimoku Kinkou Hyo, two technical indicators, in order to utilize their respective advantages and improve the accuracy of trading decisions. The Williams Double Exponential Moving Average can fully reflect trends in price changes, while Ichimoku Kinkou Hyo can provide early warnings of trend reversals.
Principles
The Williams Double Exponential Moving Average contains a fast line and a slow line. The fast line is calculated with the formula: 2*(n/2 period Weighted Moving Average), and the slow line is calculated with: n period Weighted Moving Average. When the fast line crosses above the slow line from below, it is a buy signal; when it crosses below from above, it is a sell signal.
Ichimoku Kinkou Hyo consists of four components: the tenkan sen, kijun sen, leading line and cloud layers. A golden cross between the tenkan sen and kijun sen is a buy signal, while a death cross is a sell signal. When prices break above or below the upper or lower edges of the cloud layers, it signals a buy or sell, respectively.
This strategy combines the strengths of both indicators. The first determinant is a signal from the Williams Indicator, and the second is confirmation from Ichimoku Kinkou Hyo, effectively filtering out false signals and improving decision accuracy.
Advantages
- The Williams Double Exponential Moving Average reacts sensitively and can determine a strong trend direction.
- Ichimoku Kinkou Hyo provides leading judgments and early warnings of trend reversals.
- Combining the two indicators allows them to validate each other and reduce false signals.
- Parameters can be optimized for adaption to different cycle lengths and products.
Risks and Optimization
- Frequent signals may occur in non-trending markets. Parameters can be adjusted to filter out some signals.
- There may be some lag in crossovers between the fast and slow lines. Cloud layers can be referenced to avoid missing optimal entry and exit points.
- It is recommended to combine with trend or volatility indicators to further avoid false signals.
Summary
This strategy fully utilizes the abilities of the Williams Indicator to judge trend directions and Ichimoku Kinkou Hyo to provide early warnings of reversals, significantly improving the accuracy of trading decisions. Further optimizations such as parameter tuning and combining with other indicators will allow sustainable enhancements for adapting to market changes.
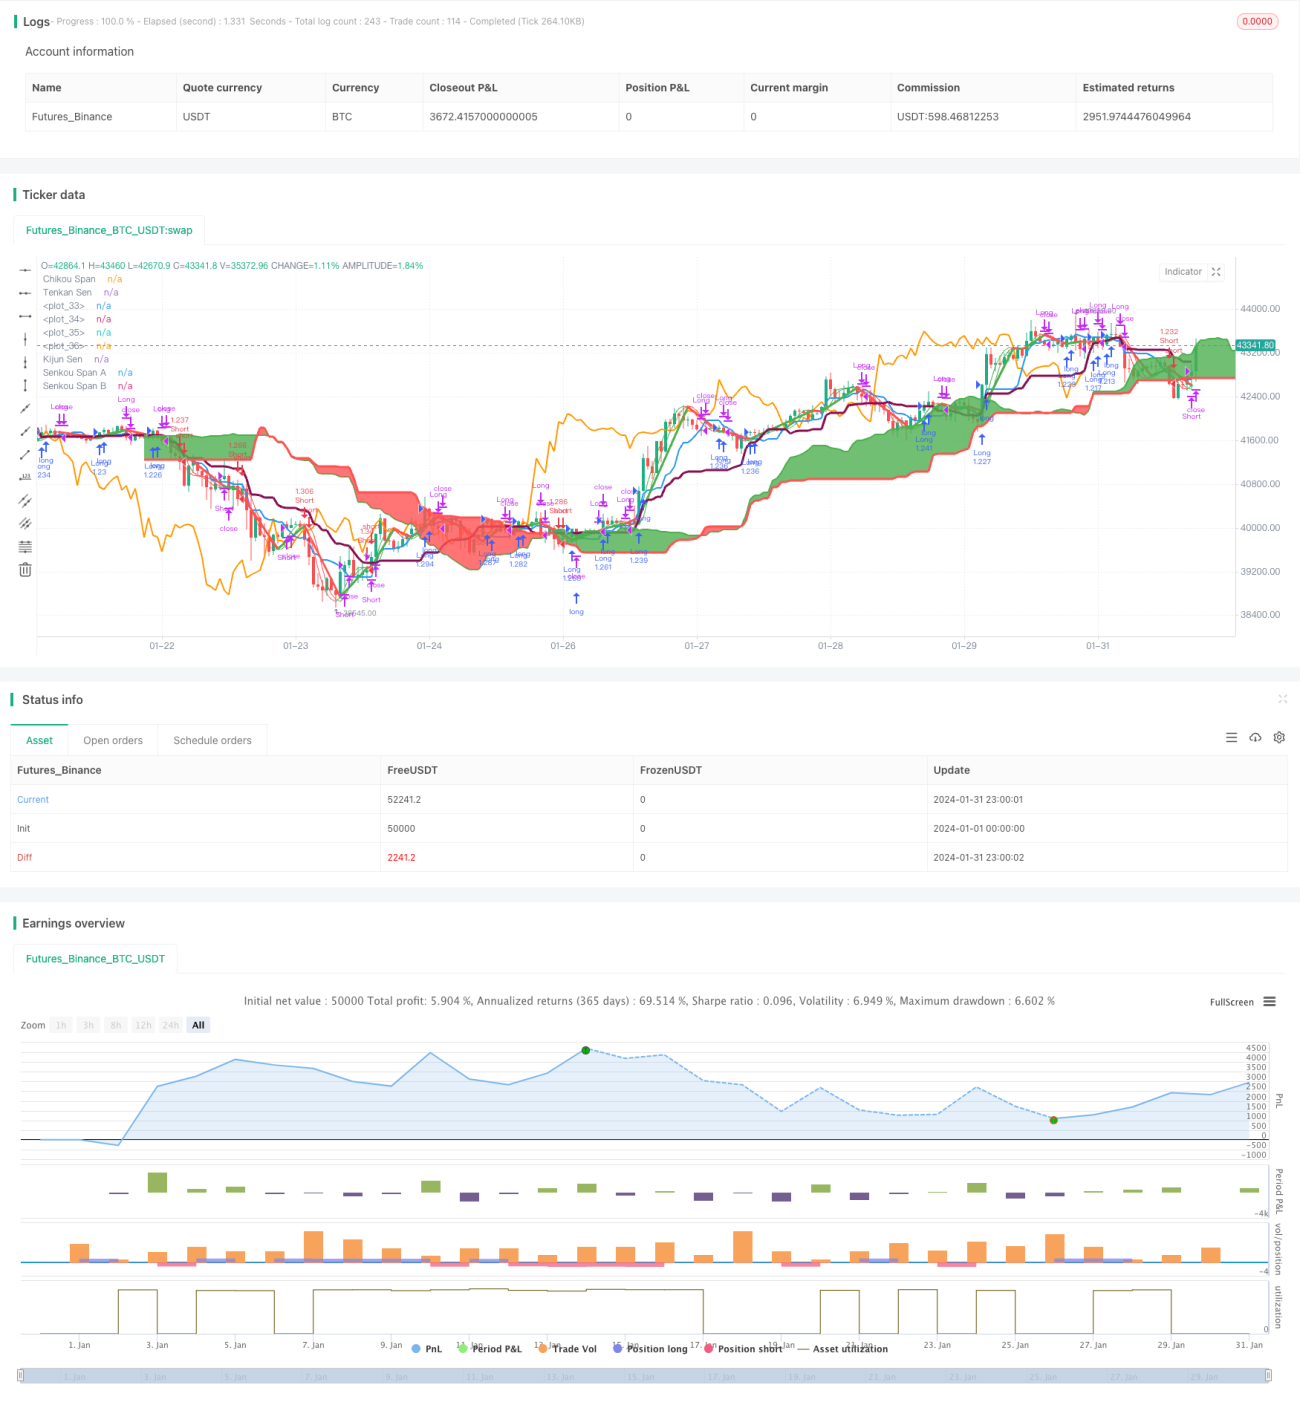
/*backtest
start: 2024-01-01 00:00:00
end: 2024-01-31 23:59:59
period: 1h
basePeriod: 15m
exchanges: [{"eid":"Futures_Binance","currency":"BTC_USDT"}]
*/

//@version=3

strategy("Hull MA-X + Ichimoku Kinko Hyo", shorttitle="Hi", overlay=true, default_qty_type=strategy.percent_of_equity, max_bars_back=1000, default_qty_value=100, calc_on_order_fills= true, calc_on_every_tick=true, pyramiding=0)
- 1