Gem Forest One Minute Scalping Strategy

Author: ChaoZhang, Date: 2024-02-19 10:45:18
Tags:

img

Overview

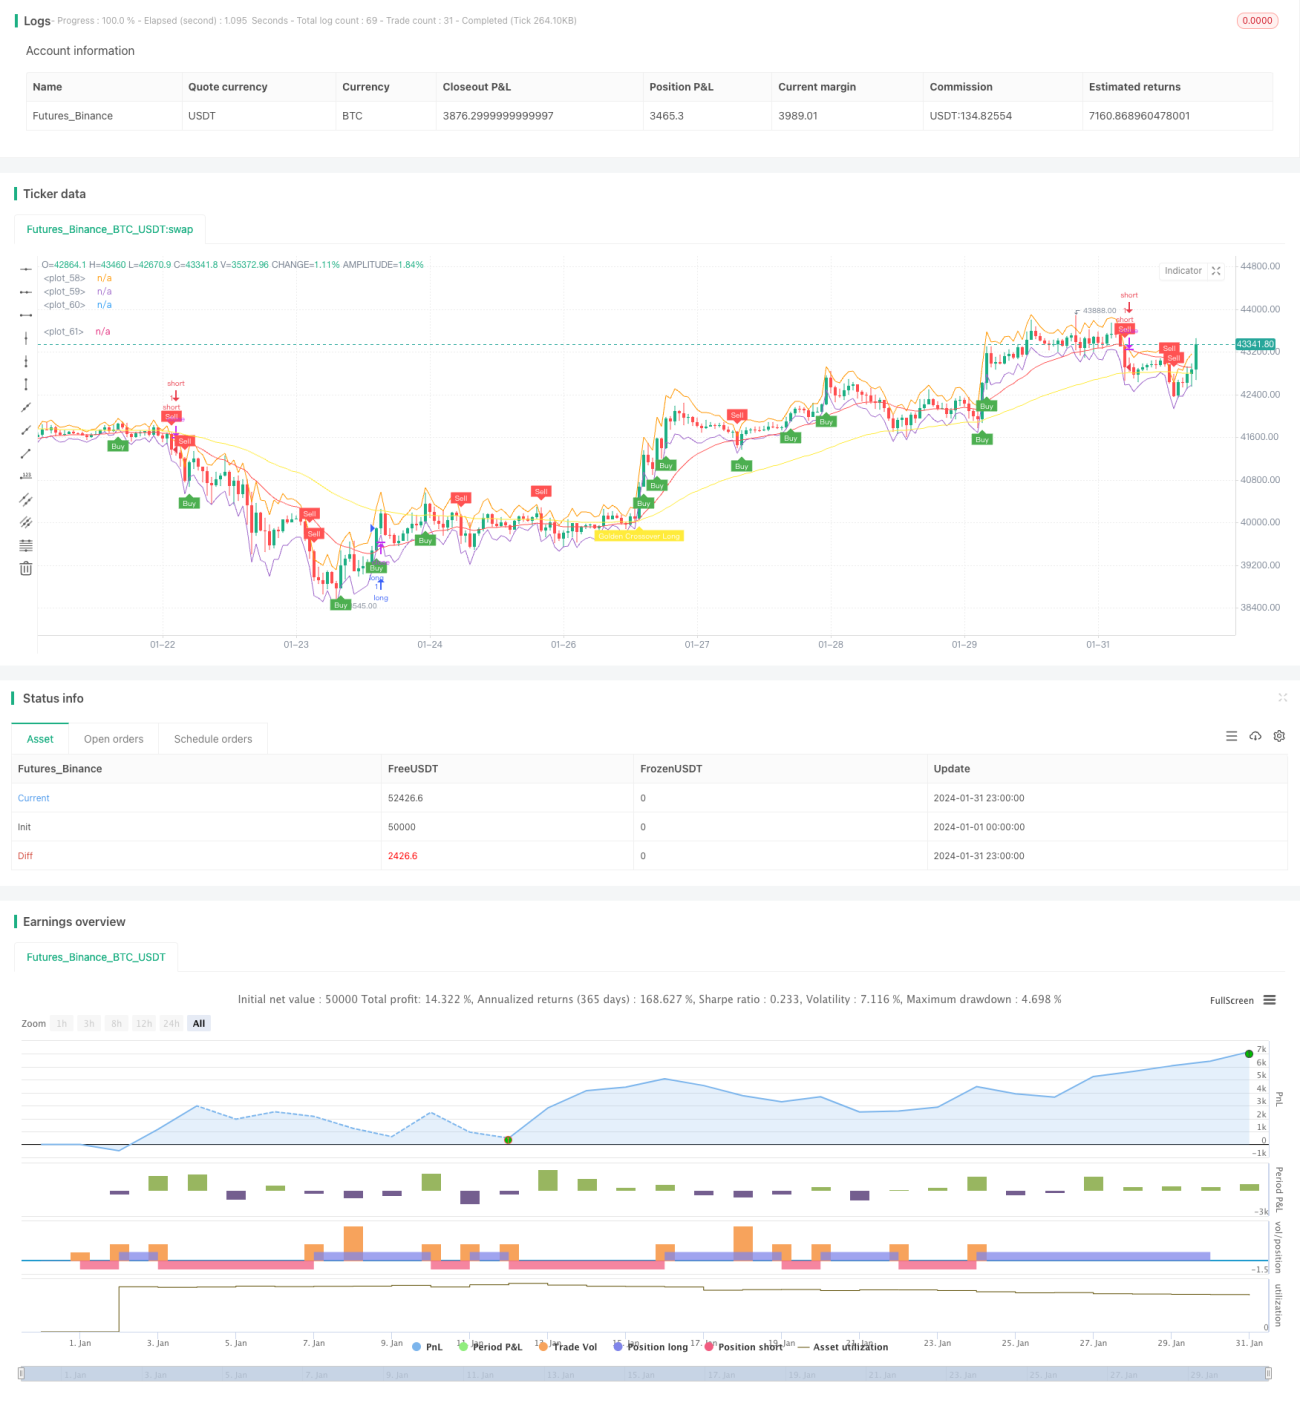
The Gem Forest One Minute Scalping Strategy is a quantitative trading strategy for short-term trading. It combines multiple indicators to identify market oscillation characteristics within a 1-minute timeframe and switch between long and short positions for ultra-short scalping.

Strategy Logic

  1. ATR indicator builds upper and lower bands to determine price oscillation range
  2. Fast and slow EMA crossovers generate trading signals
  3. Dual RSI indicators confirm crossover signals
  4. Entry and exit points are determined by combining indicator signals and price levels

When price is below the lower band, fast and slow EMA golden cross happens, fast RSI crosses above slow RSI, a buy signal is generated; When price is above upper band, fast and slow EMA dead cross happens, fast RSI crosses below slow RSI, a sell signal is generated. After entry, stop loss and take profit are used for exit.

Advantage Analysis

  1. Multiple indicators combined improves reliability
  2. High operation frequency provides greater profit potential
  3. Smaller drawdowns, better stability
  4. Capable of ultra-short scalping within 1-min or shorter timeframe

Risk Analysis

  1. Higher requirements for network and hardware due to high frequency
  2. Over-trading and capital scattering risks
  3. False signals from poor indicator configuration
  4. Vulnerable to stop loss in volatile market conditions

These risks can be managed by optimizing parameters, adjusting stops, limiting max daily trades, choosing proper products etc.

Optimization Directions

  1. Test impact of different ATR periods
  2. Try different EMA types or replace one EMA
  3. Adjust RSI periods or test other oscillators like KDJ, Stochastics etc
  4. Improve entry logic with more factors like trends
  5. Optimize stops for better risk-reward ratio

Conclusion

This strategy fully considers the characteristics of ultra-short quantitative trading. Reasonable indicator settings, multiple confirmations and combinations ensure high reliability. With strict risk control, it has considerable profit potential and suits investors with sufficient computing power and psychological quality.


/*backtest
start: 2024-01-01 00:00:00
end: 2024-01-31 23:59:59
period: 1h
basePeriod: 15m
exchanges: [{"eid":"Futures_Binance","currency":"BTC_USDT"}]
*/

//@version=5
strategy("Gem Forest 1 Dakika Scalp", overlay=true)

source = close
atrlen = input.int(14, "ATR Period")
mult = input.float(1, "ATR Multi", step=0.1)
smoothing = input.string(title="ATR Smoothing", defval="WMA", options=["RMA", "SMA", "EMA", "WMA"])

ma_function(source, atrlen) => 
    if smoothing == "RMA"
        ta.rma(source, atrlen)
    else
        if smoothing == "SMA"
            ta.sma(source, atrlen)
        else
            if smoothing == "EMA"
                ta.ema(source, atrlen)
            else
                ta.wma(source, atrlen)

atr_slen = ma_function(ta.tr(true), atrlen)
upper_band = atr_slen * mult + close
lower_band = close - atr_slen * mult

ShortEMAlen = input.int(21, "Fast EMA")
LongEMAlen = input.int(65, "Slow EMA")
shortSMA = ta.ema(close, ShortEMAlen)
longSMA = ta.ema(close, LongEMAlen)
RSILen1 = input.int(25, "Fast RSI Length")
RSILen2 = input.int(100, "Slow RSI Length")
rsi1 = ta.rsi(close, RSILen1)
rsi2 = ta.rsi(close, RSILen2)
atr = ta.atr(atrlen)

RSILong = rsi1 > rsi2
RSIShort = rsi1 < rsi2

longCondition = open < lower_band
shortCondition = open > upper_band
GoldenLong = ta.crossover(shortSMA,longSMA)
Goldenshort = ta.crossover(longSMA,shortSMA)

plotshape(shortCondition, title="Sell Label", text="Sell", location=location.abovebar, style=shape.labeldown, size=size.tiny, color=color.red, textcolor=color.white, transp=0)
plotshape(longCondition, title="Buy Label", text="Buy", location=location.belowbar, style=shape.labelup, size=size.tiny, color=color.green, textcolor=color.white, transp=0)
plotshape(Goldenshort, title="Golden Sell Label", text="Golden Crossover Short", location=location.abovebar, style=shape.labeldown, size=size.tiny, color=color.blue, textcolor=color.white, transp=0)
plotshape(GoldenLong, title="Golden Buy Label", text="Golden Crossover Long", location=location.belowbar, style=shape.labelup, size=size.tiny, color=color.yellow, textcolor=color.white, transp=0)

if (longCondition)
    stopLoss = low - atr * 2
    takeProfit = high + atr * 5
    strategy.entry("long", strategy.long, when = RSILong)

if (shortCondition)
    stopLoss = high + atr * 2
    takeProfit = low - atr * 5
    strategy.entry("short", strategy.short, when = RSIShort)

plot(upper_band)
plot(lower_band)
plot(shortSMA, color = color.red)
plot(longSMA, color = color.yellow)


More