MACD Moving Average Combination Cross-Period Dynamic Trend Strategy

Author: ChaoZhang, Date: 2024-02-19 10:48:11
Tags:

img

Overview

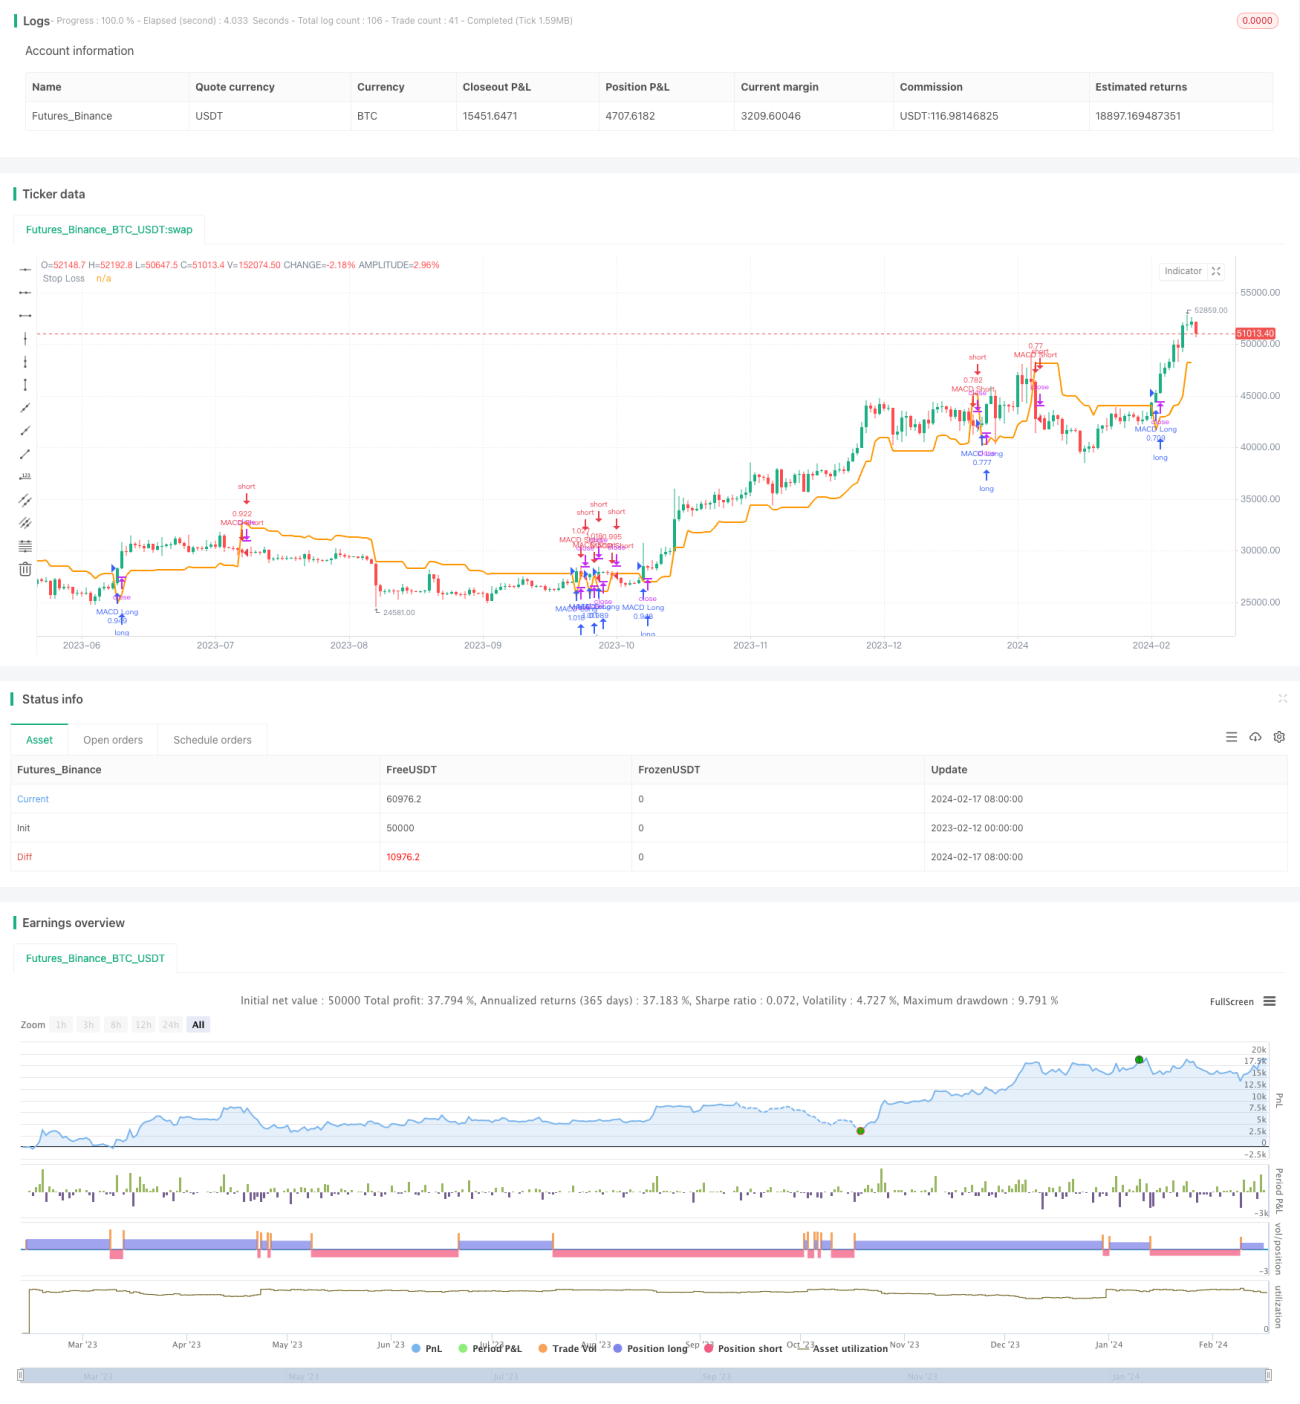
This strategy is based on the combination of moving averages of the MACD indicator to realize dynamic trend judgment across time periods. It belongs to a more classic trend tracking strategy. It mainly judges the current trend direction and strength through the difference between fast and slow moving averages of MACD and the relationship between its signal line. At the same time, cross-period judgment is introduced to improve accuracy and dynamically adjust positions.

Strategy Principle

  1. Judge the current trend direction based on the difference between the fast and slow moving averages of the MACD indicator and its signal line relationship.
  2. The MACD difference crossing above the signal line is a long signal, and crossing below is a short signal.
  3. Introduce MACD difference and MACD histogram in the same direction to enhance strategy signals.
  4. Add a cross-cycle judgment module, use the MACD indicator of a higher time frame as a signal filter and position adjustment basis.
  5. Dynamic position adjustment, reduce position size when cross-cycle signal is weaker, and increase position when signal is enhanced.

Advantage Analysis

  1. The effectiveness of MACD itself in determining trend direction is relatively high.
  2. The combination of MACD difference and histogram double verification can improve signal accuracy.
  3. Cross-cycle judgment enhances strategy stability and avoids being misled by high-frequency signals.
  4. Dynamic position adjustment enables the strategy to better grasp opportunities and increase excess returns.

Risk Analysis and Solutions

  1. MACD signals have lag, which may lead to slightly inferior signal effects.
  • Solution: Increase the difference between fast and slow moving averages to capture signals in advance.
  1. Cross-cycle signals are not necessarily accurate and may mislead strategies.
  • Solution: Introduce a dynamic position adjustment mechanism to ensure that the main cycle strategy dominates.
  1. The overall stability of multi-factor combined strategies may be insufficient.
  • Solution: Carefully adjust the proportion of each strategy parameter weight to ensure overall robustness.

Optimization Directions

  1. Test the effects of different cycle parameter combinations.
  2. Test the impact of different cross-cycle combinations on strategy effectiveness.
  3. Adjust MACD indicator parameters, such as fast and slow moving average cycles, signal line cycles, etc.
  4. Test the effects of different position adjustment factors.
  5. Test backtest effects on other varieties.

Summary

This MACD moving average combination cross-period dynamic trend strategy integrates the advantages of classic indicators and multi-time frame references. Through parameter optimization and combination testing, a relatively stable and profitable trend tracking strategy can be constructed. It is worth real-money testing and application.


/*backtest
start: 2023-02-12 00:00:00
end: 2024-02-18 00:00:00
period: 1d
basePeriod: 1h
exchanges: [{"eid":"Futures_Binance","currency":"BTC_USDT"}]
*/

//@temelbulut
//@version=5
strategy('MACD Strategy %80', overlay=true, default_qty_type=strategy.percent_of_equity, default_qty_value=50)

fastLength = input.int(title='MACD Fast Length', defval=12, minval=1)
slowLength = input.int(title='MACD Slow Length', defval=26, minval=1)
signalLength = input.int(title='MACD Signal Length', defval=9, minval=1)
crossscore = input(title='Cross (buy/sell) Score', defval=10.)
indiside = input(title='indicator Direction Score', defval=8)
histside = input(title='Histogram Direction Score', defval=2)
shotsl = input(title='Show Stop Loss Line', defval=false)
Mult = input.float(title='Stop Loss Factor', defval=1.2, minval=0.1, maxval=100)
Period = input.int(title='Stop Loss Period', defval=10, minval=1, maxval=100)
lookaheadi = input(title='Lookahead', defval=true)

HTF = timeframe.period == '1' ? '5' : timeframe.period == '3' ? '15' : timeframe.period == '5' ? '15' : timeframe.period == '15' ? '60' : timeframe.period == '30' ? '60' : timeframe.period == '45' ? '60' : timeframe.period == '60' ? '240' : timeframe.period == '120' ? '240' : timeframe.period == '180' ? '240' : timeframe.period == '240' ? 'D' : timeframe.period == 'D' ? 'W' : 'W'

calc = timeframe.period == '1' ? 5 : timeframe.period == '3' ? 5 : timeframe.period == '5' ? 3 : timeframe.period == '15' ? 4 : timeframe.period == '30' ? 4 : timeframe.period == '45' ? 4 : timeframe.period == '60' ? 4 : timeframe.period == '120' ? 3 : timeframe.period == '180' ? 3 : timeframe.period == '240' ? 6 : timeframe.period == 'D' ? 5 : 1

count() =>
    indi = ta.ema(close, fastLength) - ta.ema(close, slowLength)
    signal = ta.ema(indi, signalLength)
    Anlyse = 0.0
    // direction of indi and histogram
    hist = indi - signal
    Anlyse := indi > indi[1] ? hist > hist[1] ? indiside + histside : hist == hist[1] ? indiside : indiside - histside : 0
    Anlyse += (indi < indi[1] ? hist < hist[1] ? -(indiside + histside) : hist == hist[1] ? -indiside : -(indiside - histside) : 0)
    Anlyse += (indi == indi[1] ? hist > hist[1] ? histside : hist < hist[1] ? -histside : 0 : 0)
    // cross now earlier ?
    countcross = indi >= signal and indi[1] < signal[1] ? crossscore : indi <= signal and indi[1] > signal[1] ? -crossscore : 0.
    countcross += nz(countcross[1]) * 0.6
    Anlyse += countcross
    nz(Anlyse)

Anlys = count()
AnlysHfrm = lookaheadi ? request.security(syminfo.tickerid, HTF, count(), lookahead=barmerge.lookahead_on) : request.security(syminfo.tickerid, HTF, count(), lookahead=barmerge.lookahead_off)
Result = (AnlysHfrm * calc + Anlys) / (calc + 1)

longCondition = ta.change(Result) != 0 and Result > 0
if longCondition
    strategy.entry('MACD Long', strategy.long,alert_message = 'MACD Long')

shortCondition = ta.change(Result) != 0 and Result < 0
if shortCondition
    strategy.entry('MACD Short', strategy.short,alert_message = 'MACD Short')

countstop(pos) =>
    Upt = hl2 - Mult * ta.atr(Period)
    Dnt = hl2 + Mult * ta.atr(Period)
    TUp = 0.
    TDown = 0.
    TUp := close[1] > TUp[1] ? math.max(Upt, TUp[1]) : Upt
    TDown := close[1] < TDown[1] ? math.min(Dnt, TDown[1]) : Dnt
    tslmtf = pos == 1 ? TUp : TDown
    tslmtf

pos = longCondition ? 1 : -1
stline = 0.
countstop__1 = countstop(pos)
security_1 = request.security(syminfo.tickerid, HTF, countstop__1)
stline := ta.change(time(HTF)) != 0 or longCondition or shortCondition ? security_1 : nz(stline[1])
plot(stline, color=shotsl ? color.rgb(148, 169, 18) : na, style=plot.style_line, linewidth=2, title='Stop Loss')


More