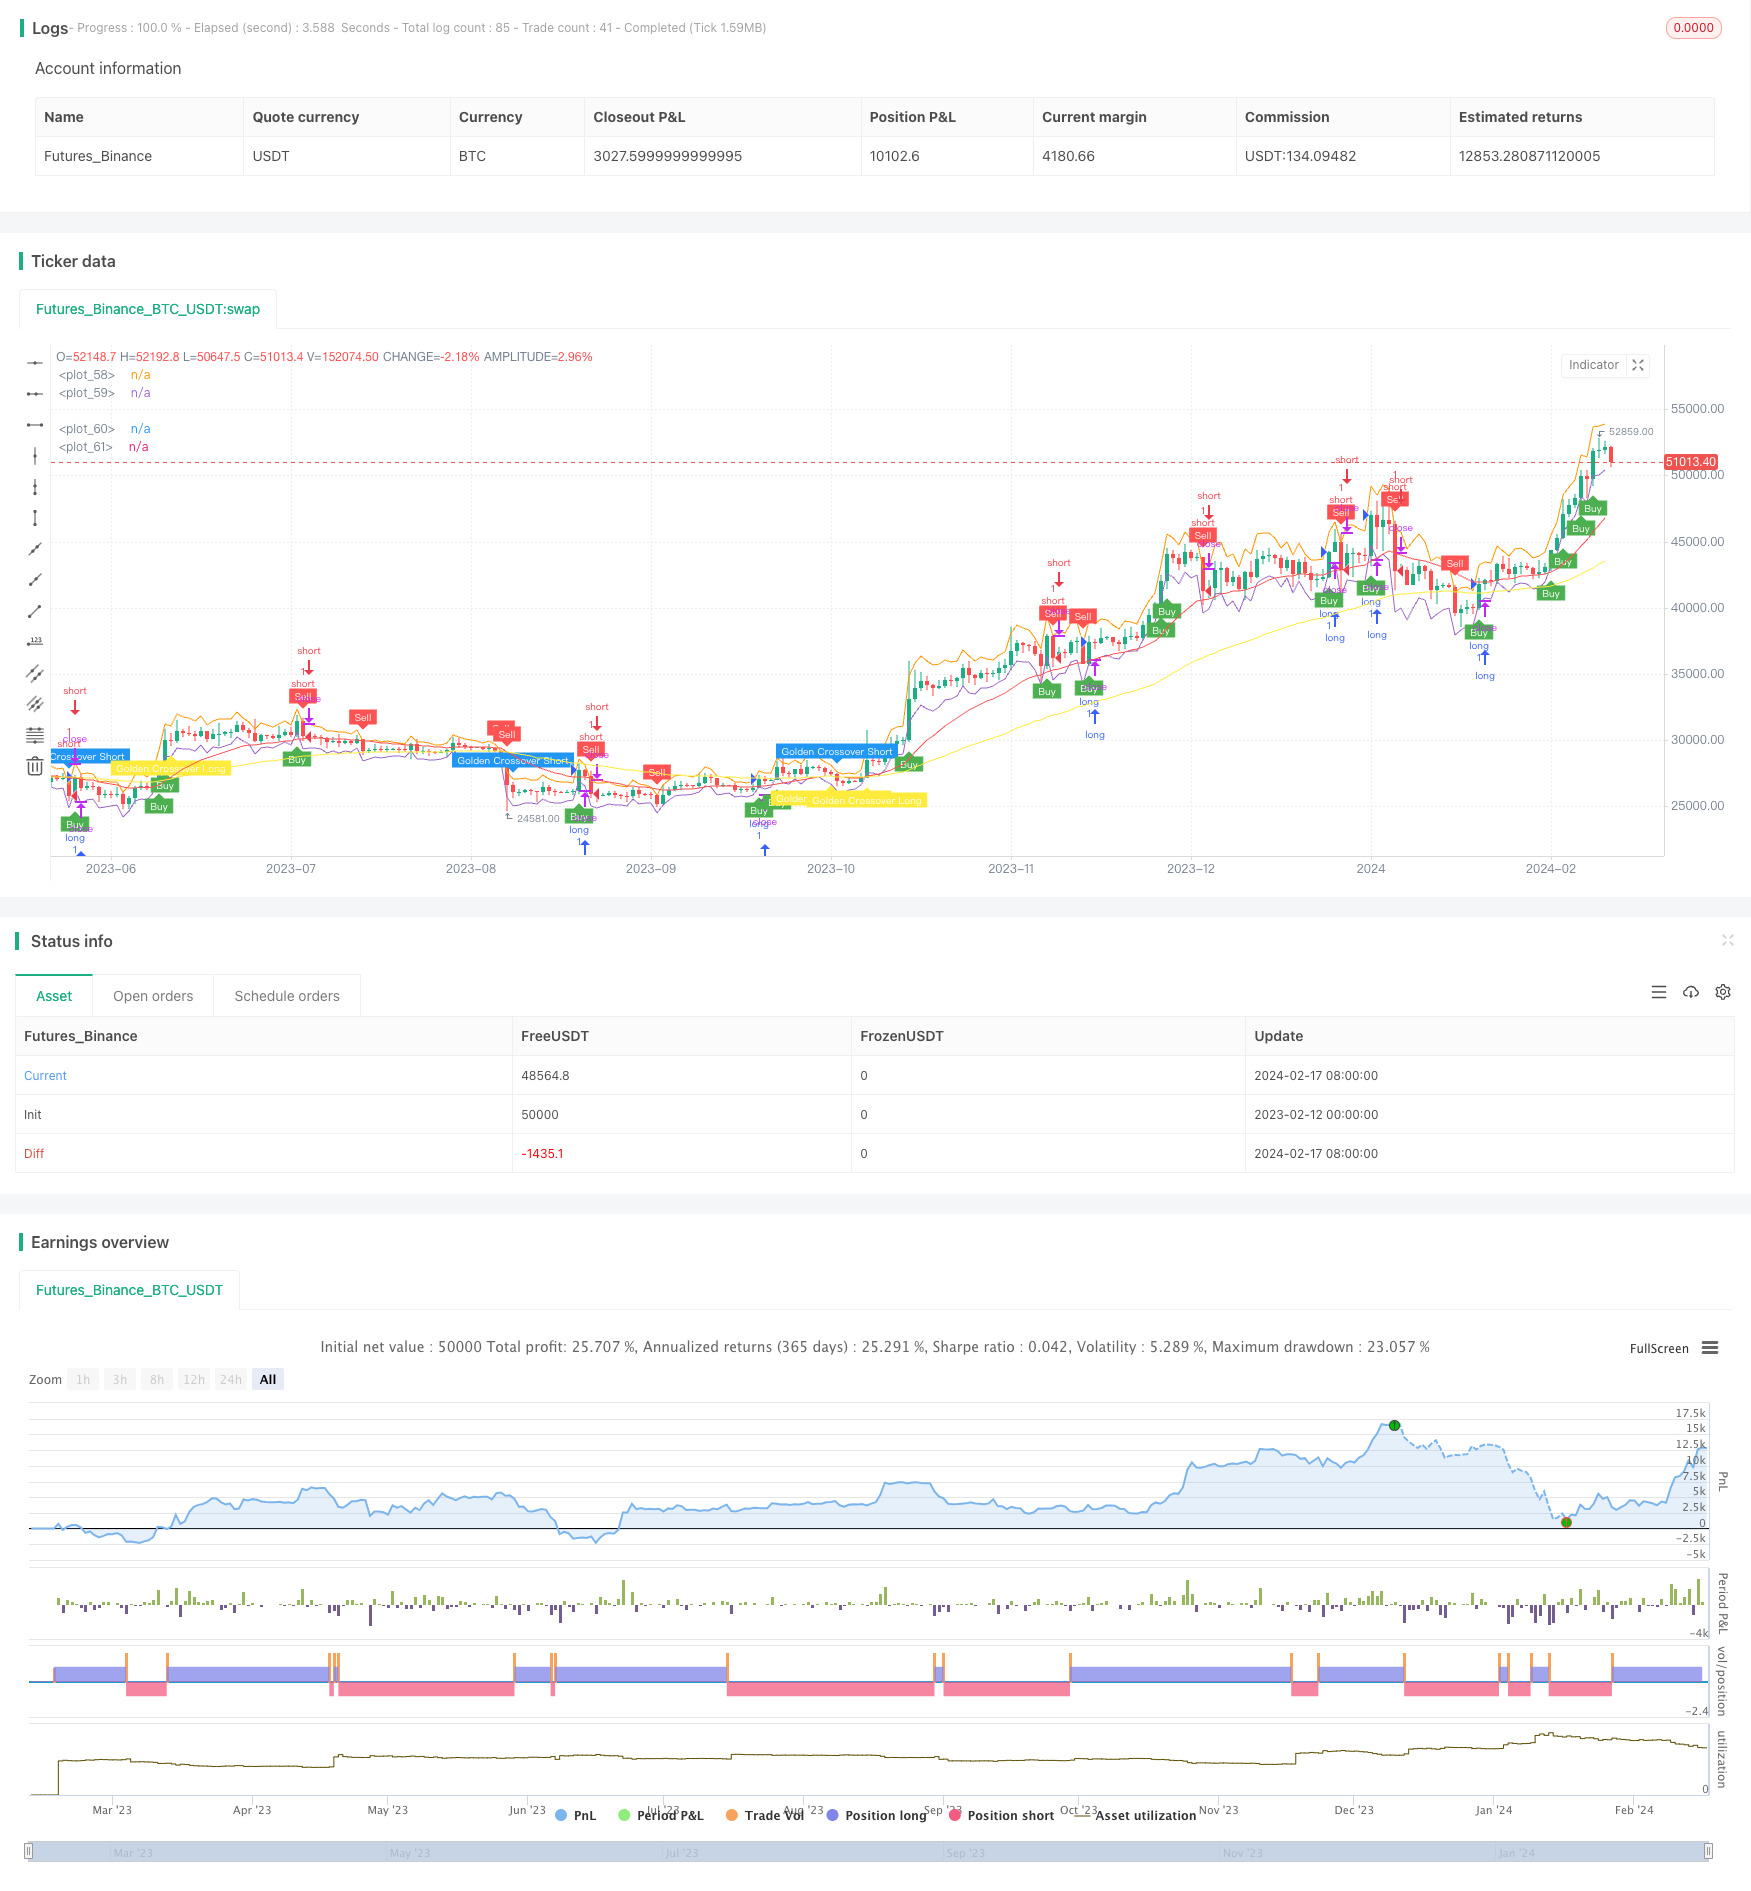
概述
黄金森林1分钟突破策略是一种短线量化交易策略,致力于捕捉价格在1分钟时间框架内的突破信号,实现快速盈利。该策略融合均线、ATR、RSI等多个指标,形成交易信号,以期在短时间内实现更高的盈亏比。
策略原理
该策略主要基于以下几个要素形成交易信号:
- ATR指标 - 计算价格的平均真实波动范围,用来设置价格通道;
- 均线指标 - 计算快速EMA和慢速EMA,形成金叉死叉信号;
- RSI指标 - 计算快慢RSI,判断超买超卖区域;
- 价格与通道的关系 - 当价格突破上下通道时,发出交易信号。
具体来说,策略会计算ATR的N周期平均值,以及快速EMA、慢速EMA和快慢RSI。结合价格突破ATR通道,以及EMA形成金叉和RSI达到超买超卖水平这三个条件,策略会发出买入或卖出的信号。
优势分析
该策略主要具有以下优势:
- 捕捉价格的短期趋势;
- 响应迅速,适合高频交易;
- 利用多种指标进行滤波,可靠性较高;
- parametric,用户可以自行优化参数。
风险分析
该策略也存在一些风险:
- 短线交易风险高,需要严格的止损;
- 参数优化不当可能导致过拟合;
- 交易频率过高,交易成本增大。
为了控制风险,应采取止损策略,同时优化参数时做好回测,避免过拟合。此外,调整交易频率,控制交易成本。
优化方向
该策略可以从以下几个方向进行优化:
1.测试更短周期(5分钟、15分钟)的参数设置;
2.加入更多过滤指标,例如交易量指标等,提高信号质量;
3.优化ATR通道和均线参数,寻找最佳参数组合。
总结
黄金森林1分钟突破策略,专注于抓住短期价格趋势,通过多指标联合过滤,具有响应迅速、盈亏比高的特点。该策略可根据用户风险偏好,通过参数优化获得更好的表现。但用户需要注意控制交易风险,包括严格止损和合理交易频率等。总体而言,该策略适合有一定量化交易基础与风险承受能力的投资者进行短线操作。
策略源码
/*backtest
start: 2023-02-12 00:00:00
end: 2024-02-18 00:00:00
period: 1d
basePeriod: 1h
exchanges: [{"eid":"Futures_Binance","currency":"BTC_USDT"}]
*/

//@version=5
strategy("Gem Forest 1 Dakika Scalp", overlay=true)

source = close
atrlen = input.int(14, "ATR Period")
mult = input.float(1, "ATR Multi", step=0.1)
smoothing = input.string(title="ATR Smoothing", defval="WMA", options=["RMA", "SMA", "EMA", "WMA"])

ma_function(source, atrlen) =>
    if smoothing == "RMA"
        ta.rma(source, atrlen)
    else
        if smoothing == "SMA"
            ta.sma(source, atrlen)
        else
            if smoothing == "EMA"
                ta.ema(source, atrlen)
            else
                ta.wma(source, atrlen)

atr_slen = ma_function(ta.tr(true), atrlen)
upper_band = atr_slen * mult + close
lower_band = close - atr_slen * mult

ShortEMAlen = input.int(21, "Fast EMA")
LongEMAlen = input.int(65, "Slow EMA")
shortSMA = ta.ema(close, ShortEMAlen)
longSMA = ta.ema(close, LongEMAlen)
RSILen1 = input.int(25, "Fast RSI Length")
RSILen2 = input.int(100, "Slow RSI Length")
rsi1 = ta.rsi(close, RSILen1)
rsi2 = ta.rsi(close, RSILen2)
atr = ta.atr(atrlen)

RSILong = rsi1 > rsi2
RSIShort = rsi1 < rsi2

longCondition = open < lower_band
shortCondition = open > upper_band
GoldenLong = ta.crossover(shortSMA,longSMA)
Goldenshort = ta.crossover(longSMA,shortSMA)

plotshape(shortCondition, title="Sell Label", text="Sell", location=location.abovebar, style=shape.labeldown, size=size.tiny, color=color.new(color.red, 0), textcolor=color.white)
plotshape(longCondition, title="Buy Label", text="Buy", location=location.belowbar, style=shape.labelup, size=size.tiny, color=color.new(color.green, 0), textcolor=color.white)
plotshape(Goldenshort, title="Golden Sell Label", text="Golden Crossover Short", location=location.abovebar, style=shape.labeldown, size=size.tiny, color=color.new(color.blue, 0), textcolor=color.white)
plotshape(GoldenLong, title="Golden Buy Label", text="Golden Crossover Long", location=location.belowbar, style=shape.labelup, size=size.tiny, color=color.new(color.yellow, 0), textcolor=color.white)

if (longCondition)
    stopLoss = low - atr * 2
    takeProfit = high + atr * 5
    strategy.entry("long", strategy.long)

if (shortCondition)
    stopLoss = high + atr * 2
    takeProfit = low - atr * 5
    strategy.entry("short", strategy.short)

plot(upper_band)
plot(lower_band)
plot(shortSMA, color = color.red)
plot(longSMA, color = color.yellow)