LPB Microcycles Adaptive Oscillation Contour Tracking Strategy

Overview
The strategy uses the Hodrick-Prescott (HP) filter to smooth the price and extract the price trend. Then it calculates a customized weighted average price (VWAP) based on the user-defined time range. It goes long when the price is above the trendline and goes short when below. It also incorporates ATR stop loss to control trading risk.
Strategy Principles
-
Use HP filter to extract price trend. HP filter uses optimization methods to extract the long-term trend component of prices while filtering out short-term fluctuations.
-
Calculate VWAP based on user-customized time range. VWAP can reflect average prices across periods more accurately.
-
Meet the long condition when price is above HP trendline; meet the short condition when price is below. This captures upside breakouts or downside breakdowns.
-
ATR stop loss assumes reasonable risk and prevents excessive losses.
Advantage Analysis
-
HP filter extracts smoother price trends than MA-based indicators, avoiding distraction from short-term price swings.
-
Customizable VWAP periods adapt better to changing market cycles.
-
Trading along the trend direction aligns with trend trading concepts and has higher win rates.
-
ATR stop loss controls loss per trade, preventing oversized losses.
-
Highly adjustable parameters provide greater optimization space for different markets.
Risks & Solutions
-
Stop loss may get hit frequently during range-bound consolidations. Can loosen stop loss slightly.
-
End-of-trend retracements often produce false breakouts that trap the strategy. Should combine with other indicators to identify end of trends and close positions timely.
-
Improper VWAP period settings may miss more effective trading opportunities. Should dynamically adjust VWAP period with trend indicators.
Optimization Directions
-
HP filter parameter λ adjusts the smoothing intensity. Larger λ makes trendline smoother and better captures long-term trends; smaller λ makes it more responsive to price changes and suits middle-short opportunities.
-
ATR multiplier tunes stop loss range. Can coordinate with λ parameter for optimization. Larger λ warrants wider stops; smaller λ allows tighter stops and locks in more profits.
-
Risk:Reward ratio directly impacts P&L ratio. Can test different ratios for drawdown control and profit potential.
Conclusion
The strategy overall adopts a trend following approach. Extensive parameter tuning targets optimization across long, medium and short timeframes, with strong win rates and profit potential. Reasonable risk control prevents oversized losses per trade. In summary, by extracting price trends scientifically and highly adjustable parameters, the strategy has good application prospects.
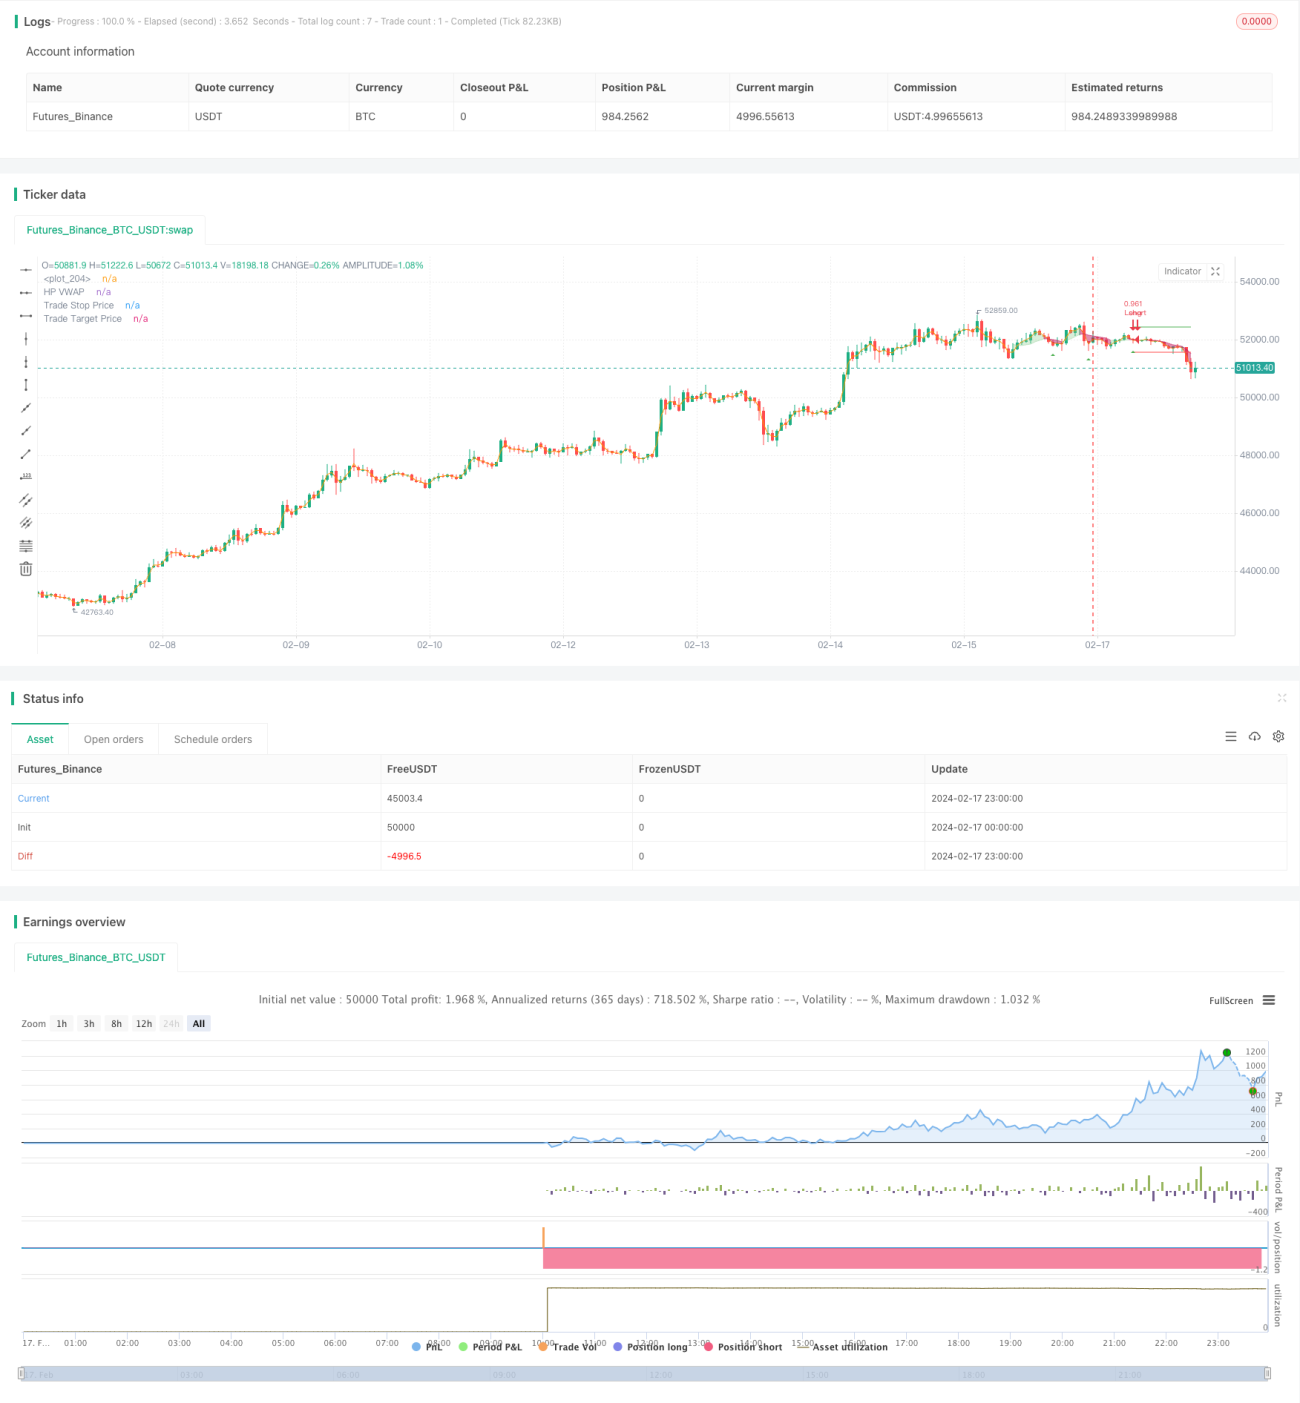
/*backtest
start: 2024-02-17 00:00:00
end: 2024-02-18 00:00:00
period: 1h
basePeriod: 15m
exchanges: [{"eid":"Futures_Binance","currency":"BTC_USDT"}]
*/

// This source code is subject to the terms of the Mozilla Public License 2.0 at https://mozilla.org/MPL/2.0/
// © tathal animouse hajixde

//@version=4- 1