概述
超级ATR趋势跟踪策略是一种基于ATR指标的趋势跟踪策略。它使用ATR指标来测量市场的波动性,并以ATR的若干倍作为止损线,实现趋势跟踪。
策略原理
该策略首先计算ATR指标,其中ATR指标是过去N天内的股价波动幅度的移动平均,用来表示市场风险和波动性。策略允许我们更改ATR的计算方法,可以选择普通ATR或者SMA方式计算。
然后根据ATR值乘以一个倍数作为通道上下轨,即计算上轨:close - Multiplier * ATR;计算下轨:close + Multiplier * ATR。这构成了基于ATR指标的趋势通道。
进而我们判断当前价格是否突破通道上下轨。如果价格突破上轨,则判断为进入下降趋势;如果价格突破下轨,则判断为进入上涨趋势。在趋势突破时,我们 correspondingly 进行买入和卖出。
此外,策略还设定了交易时间窗口,只在指定的日期时间段内交易。
策略优势
这种基于指标通道的趋势跟踪策略,具有以下几个优点:
- 使用ATR指标自动调整止损位置,能够有效控制风险
- ATR指标考虑了股价波动性,止损线更合理
- 采用通道突破判断入场,增加了入场精确度
- 允许调整ATR计算方式,增加了策略灵活性
- 设置交易时间窗口,避免重大事件的策略失效
总的来说,这是一个简单实用的趋势跟踪策略,能够有效控制风险,同时获得较好的收益。
风险分析
该策略也存在一些风险,主要有:
- 市场出现剧烈变动时,ATR指标可能来不及反应市场变化,导致止损过于宽松
- 多空意见不一致时,价格可能在通道内震荡,增加交易风险
- 固定的倍数设置可能不适合全部品种,需要针对不同品种调整
- setWindow限制了交易机会,如果没设定好,可能错过较好交易机会
为了控制这些风险,我们可以采取以下措施:
- 结合其他指标判断市场状态,避免单一依赖ATR指标
- 增加过滤条件,避免无效突破引入交易风险
- 根据不同品种历史特征选择合适的倍数
- 优化和测试setWindow的参数,确保其设置合理
优化方向
这种策略还有进一步优化的空间:
- 可以引入机器学习算法,实现倍数的动态优化
- 可以结合情绪指标等判断多空杠杆,优化通道范围
- 增加交易量或波动确认,避免无效突破
- 利用高级基于时间的策略框架进行Backtest
通过这些优化,可以进一步提高策略的稳定性和收益率。
总结
本策略overall是一个非常实用的趋势跟踪策略。它使用ATR指标构建自适应通道,并以通道突破判断买卖时机。策略简单实用,能有效控制风险,适合跟踪中长线趋势。我们也提出了进一步的风险控制和策略优化建议,这将使该策略更加强大和稳健。
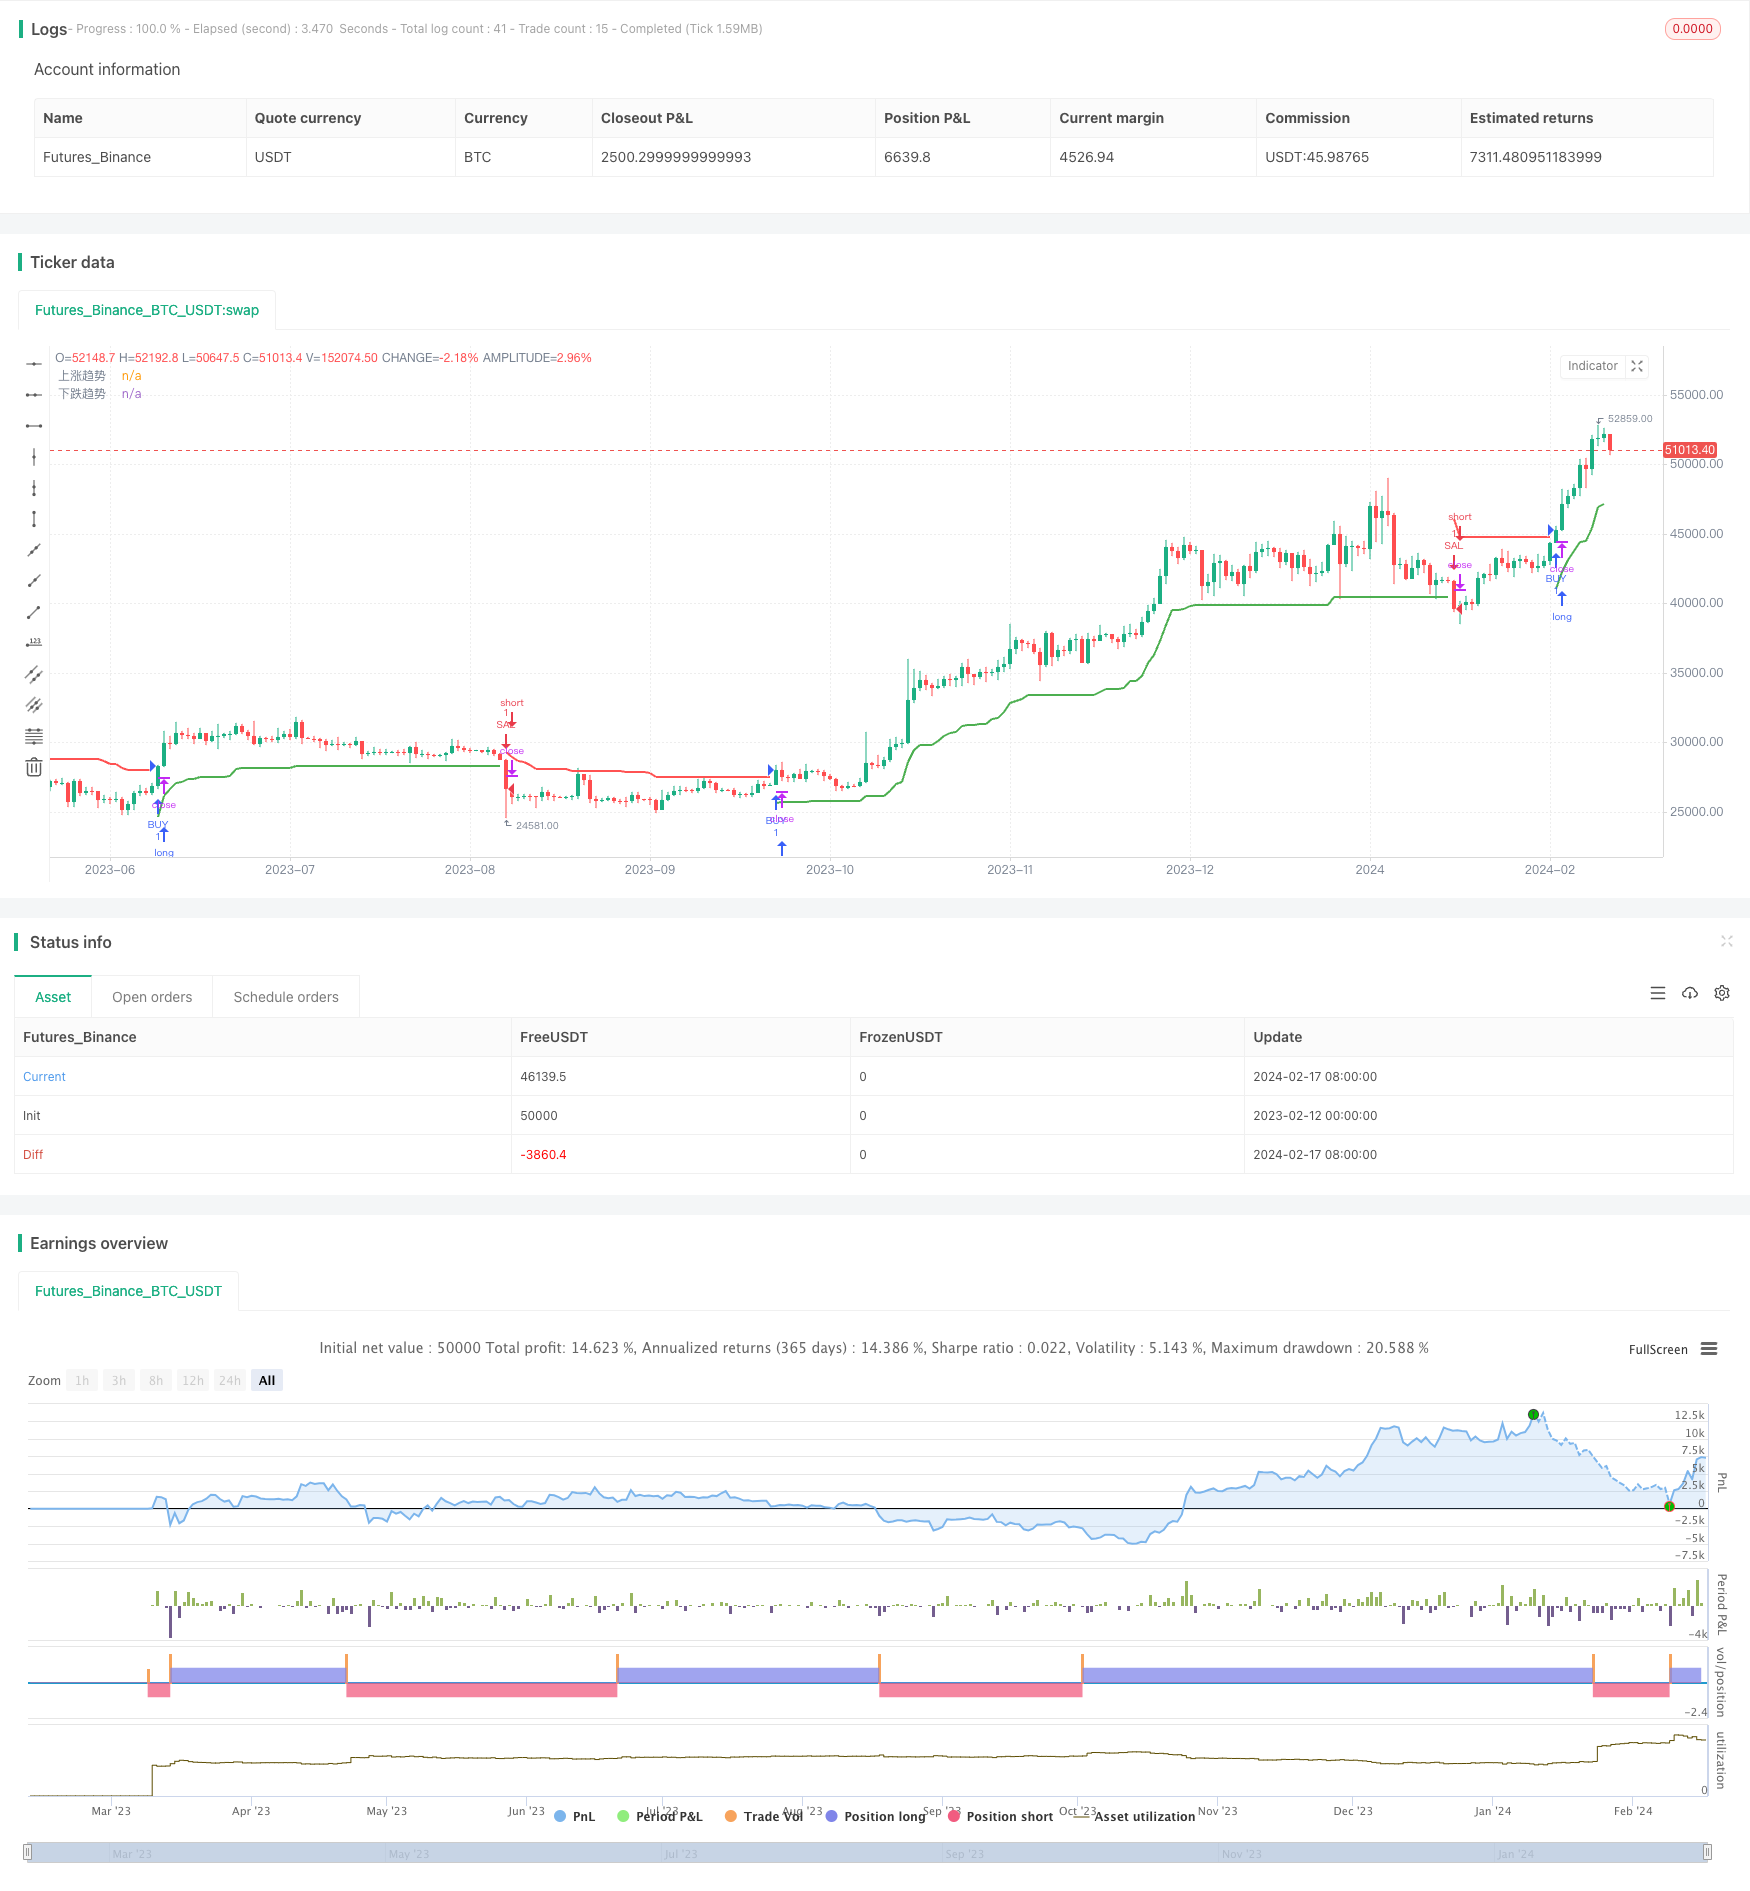
策略源码
/*backtest
start: 2023-02-12 00:00:00
end: 2024-02-18 00:00:00
period: 1d
basePeriod: 1h
exchanges: [{"eid":"Futures_Binance","currency":"BTC_USDT"}]
*/

//@version=5
strategy('B厂长 @超级趋势精简优化版', overlay=true)
Periods = input(title='ATR周期', defval=10)
src = input(hl2, title='价格数据源')
Multiplier = input.float(title='ATR 乘数', step=0.1, defval=3.0)
changeATR = input(title='更改ATR计算方法', defval=true,tooltip = '默认为art否则sma(ta.tr,ATR周期)')
showsignals = input(title='显示买入/卖出信号', defval=false)
atr2 = ta.sma(ta.tr, Periods)
atr = changeATR ? ta.atr(Periods) : atr2
up = src - Multiplier * atr
up1 = nz(up[1], up)
up := close[1] > up1 ? math.max(up, up1) : up
dn = src + Multiplier * atr
dn1 = nz(dn[1], dn)
dn := close[1] < dn1 ? math.min(dn, dn1) : dn
trend = 1
trend := nz(trend[1], trend)
trend := trend == -1 and close > dn1 ? 1 : trend == 1 and close < up1 ? -1 : trend
upPlot = plot(trend == 1 ? up : na, title='上涨趋势', style=plot.style_linebr, linewidth=2, color=color.new(color.green, 0))
buySignal = trend == 1 and trend[1] == -1
plotshape(buySignal and showsignals ? up : na, title='买点', text='买点', location=location.absolute, style=shape.labelup, size=size.tiny, color=color.new(color.green, 0), textcolor=color.new(color.white, 0))
dnPlot = plot(trend == 1 ? na : dn, title='下跌趋势', style=plot.style_linebr, linewidth=2, color=color.new(color.red, 0))
sellSignal = trend == -1 and trend[1] == 1
plotshape(sellSignal and showsignals ? dn : na, title='卖点', text='卖点', location=location.absolute, style=shape.labeldown, size=size.tiny, color=color.new(color.red, 0), textcolor=color.new(color.white, 0))
FromMonth = input.int(defval=9, title='From Month', minval=1, maxval=12)
FromDay = input.int(defval=1, title='From Day', minval=1, maxval=31)
FromYear = input.int(defval=2018, title='From Year', minval=999)
ToMonth = input.int(defval=1, title='To Month', minval=1, maxval=12)
ToDay = input.int(defval=1, title='To Day', minval=1, maxval=31)
ToYear = input.int(defval=9999, title='To Year', minval=999)
start = timestamp(FromYear, FromMonth, FromDay, 00, 00)
finish = timestamp(ToYear, ToMonth, ToDay, 23, 59)
window() =>
    time >= start and time <= finish ? true : false
longCondition = buySignal
if longCondition and window()
    strategy.entry('BUY', strategy.long, comment = '做多')
shortCondition = sellSignal
if shortCondition and window()
    strategy.entry('SAL', strategy.short, comment = '做空')

buy1 = ta.barssince(buySignal)
sell1 = ta.barssince(sellSignal)
color1 = buy1[1] < sell1[1] ? color.green : buy1[1] > sell1[1] ? color.red : na