概述
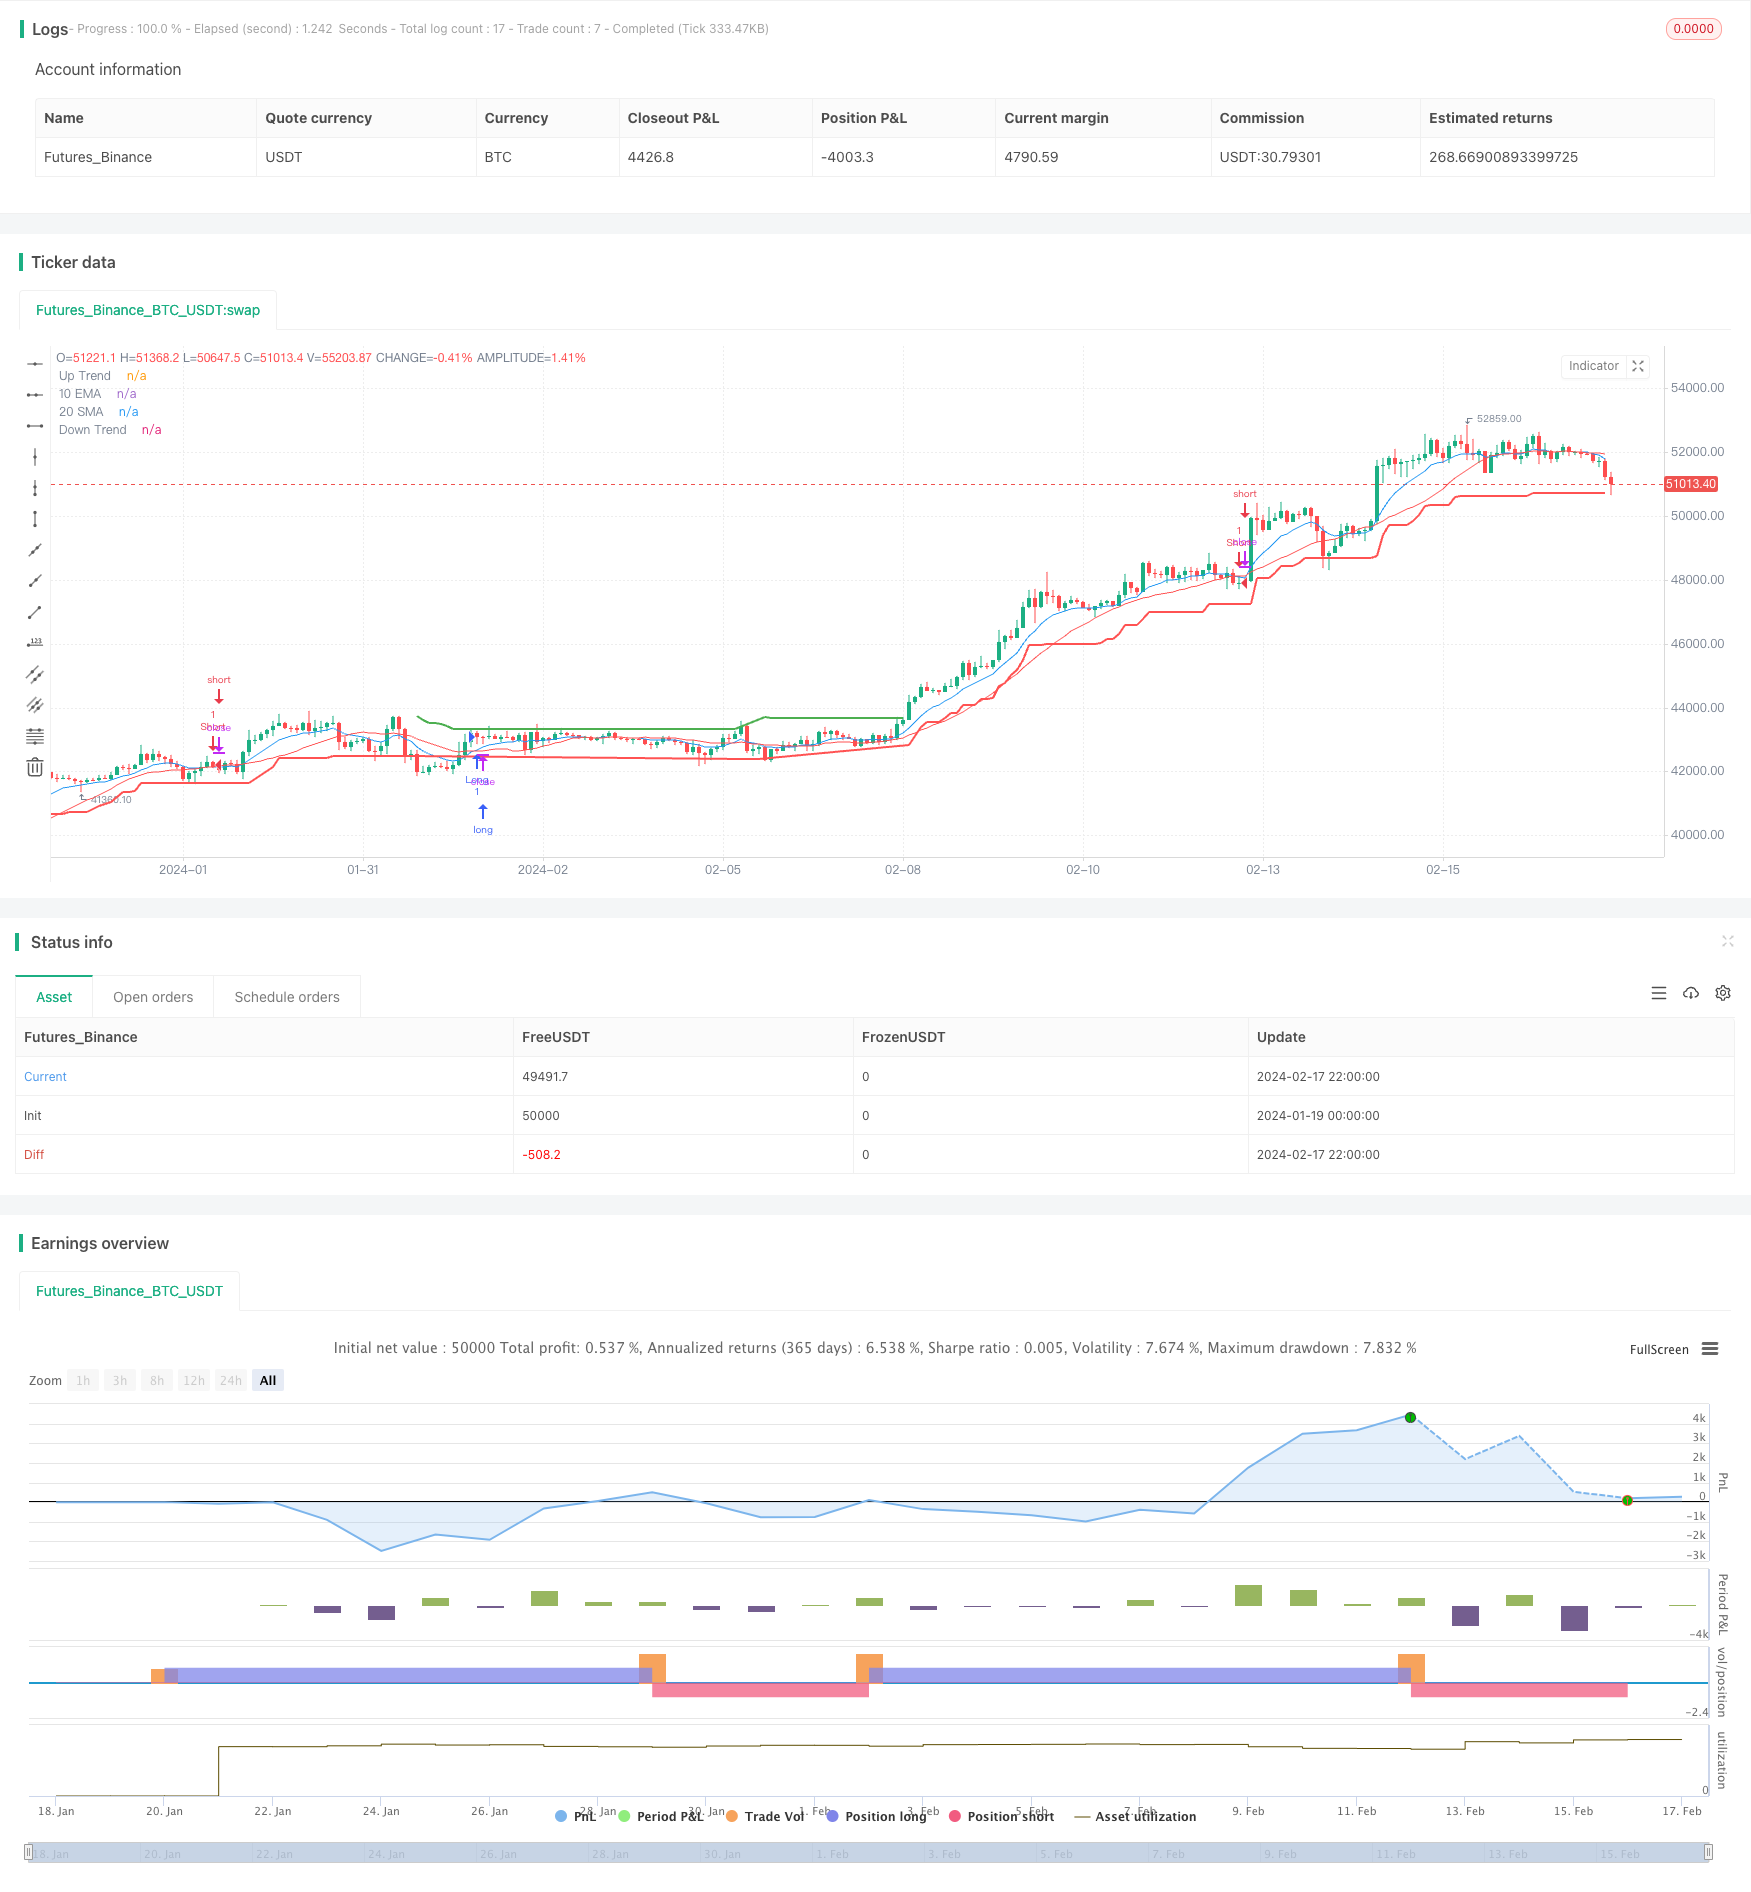
本策略名称为“超级趋势与移动平均线结合策略”。该策略结合使用超级趋势指标和移动平均线,在超级趋势指示上升趋势而10日EMA又高于20日SMA时做多,在超级趋势指示下跌趋势而10日EMA又低于20日SMA时做空,是一个典型的趋势跟踪策略。
策略原理
本策略使用超级趋势指标判断市场趋势方向。超级趋势指标基于Average True Range和Factor来计算,当价格高于超级趋势线时为上升趋势,当价格低于超级趋势线时为下跌趋势。本策略中的Factor取3.0,ATR长度取10。
另外,策略中使用10日EMA和20日SMA构建移动平均线。EMA(指数移动平均线)对最近期价格赋予更高权重,SMA(简单移动平均线)按照平等权重考虑所有数据。当短期EMA高于长期SMA时,被视为买入信号。
综合来说,本策略的交易信号Generation逻辑为:
多头入场:超级趋势>0(上升趋势) 且 10日EMA > 20日SMA
空头入场:超级趋势(下跌趋势) 且 10日EMA < 20日SMA
也就是在超级趋势确定趋势方向的同时,利用移动平均线的金叉死叉作为辅助判断,构建该趋势跟踪策略。
优势分析
本策略最大的优势在于结合超级趋势和移动平均线两个指标,使得可靠性和灵敏度 both得到提高。具体来说主要有以下几个优势:
- 超级趋势指标判断主趋势非常清晰,可减少假信号
- EMA和SMA的配合可提高对趋势转折的灵敏度
- 同时判断多种因素,综合判断信号,可靠性更高
- 使用简单清晰的指标,容易理解和优化
- 可配置超级趋势和移动平均线的参数,优化空间大
风险分析
本策略也存在一些风险,主要体现在以下几个方面:
- 超级趋势参数设置不当可能错过转折点
- 移动平均线参数设置不当可能产生假信号
- 回测周期选取不当,可能高估策略效果
- 没有考虑交易成本的影响
对于超级趋势,可以测试不同的ATR长度和Factor参数来优化;对于移动平均线可以测试EMA和SMA的长度;回测周期要充分考虑不同市场环境。此外,实盘过程中一定要加入适当的交易成本。
优化方向
本策略的优化空间较大,主要可以从以下几个方面进行优化:
- 调整超级趋势中的ATR长度和Factor参数
- 调整EMA和SMA的长度参数
- 添加其他指标过滤信号,如RSI,MACD等
- 调整买入条件为超级趋势上涨且EMA上穿SMA一定周期后
- 添加止损策略
通过参数调整和添加辅助指标过滤,可以进一步提高策略表现和稳定性。此外,配置止损策略也很重要,可以有效控制风险。
总结
本策略名称为“超级趋势与移动平均线结合策略”,结合使用超级趋势判断趋势方向,以及EMA和SMA构建交易信号,属于典型的趋势跟踪策略。该策略可靠性较高,优化空间较大,值得实盘验证优化。但也要注意控制风险,防止参数优化过度。
/*backtest
start: 2024-01-19 00:00:00
end: 2024-02-18 00:00:00
period: 2h
basePeriod: 15m
exchanges: [{"eid":"Futures_Binance","currency":"BTC_USDT"}]
*/

//@version=5
strategy("Supertrend and Moving Averages Strategy", overlay=true)

// Supertrend parameters
atrLength = input.int(10, title="ATR Length", minval=1)
factor = input.float(3.0, title="Factor", minval=0.01, step=0.01)
[supertrend, direction] = ta.supertrend(factor, atrLength)

// Moving Averages parameters
length_ema = input(10, title="Length of EMA")
length_sma = input(20, title="Length of SMA")

// Calculate EMAs and SMAs
ema_10 = ta.ema(close, length_ema)
sma_20 = ta.sma(close, length_sma)

// Strategy logic
longCondition = ema_10 > sma_20 and direction > 0
shortCondition = ema_10 < sma_20 and direction < 0

strategy.entry("Long", strategy.long, when=longCondition)
strategy.entry("Short", strategy.short, when=shortCondition)

// Plot Supertrend
plot(direction > 0 ? supertrend : na, color=color.green, style=plot.style_line, linewidth=2, title="Up Trend")
plot(direction < 0 ? supertrend : na, color=color.red, style=plot.style_line, linewidth=2, title="Down Trend")

// Plot Moving Averages
plot(ema_10, color=color.blue, title="10 EMA")
plot(sma_20, color=color.red, title="20 SMA")

// Alerts for Supertrend
alertcondition(direction[1] > direction, title='Downtrend to Uptrend', message='The Supertrend value switched from Downtrend to Uptrend ')
alertcondition(direction[1] < direction, title='Uptrend to Downtrend', message='The Supertrend value switched from Uptrend to Downtrend')
alertcondition(direction[1] != direction, title='Trend Change', message='The Supertrend value switched from Uptrend to Downtrend or vice versa')