Absolute Momentum Indicator Strategy

Overview
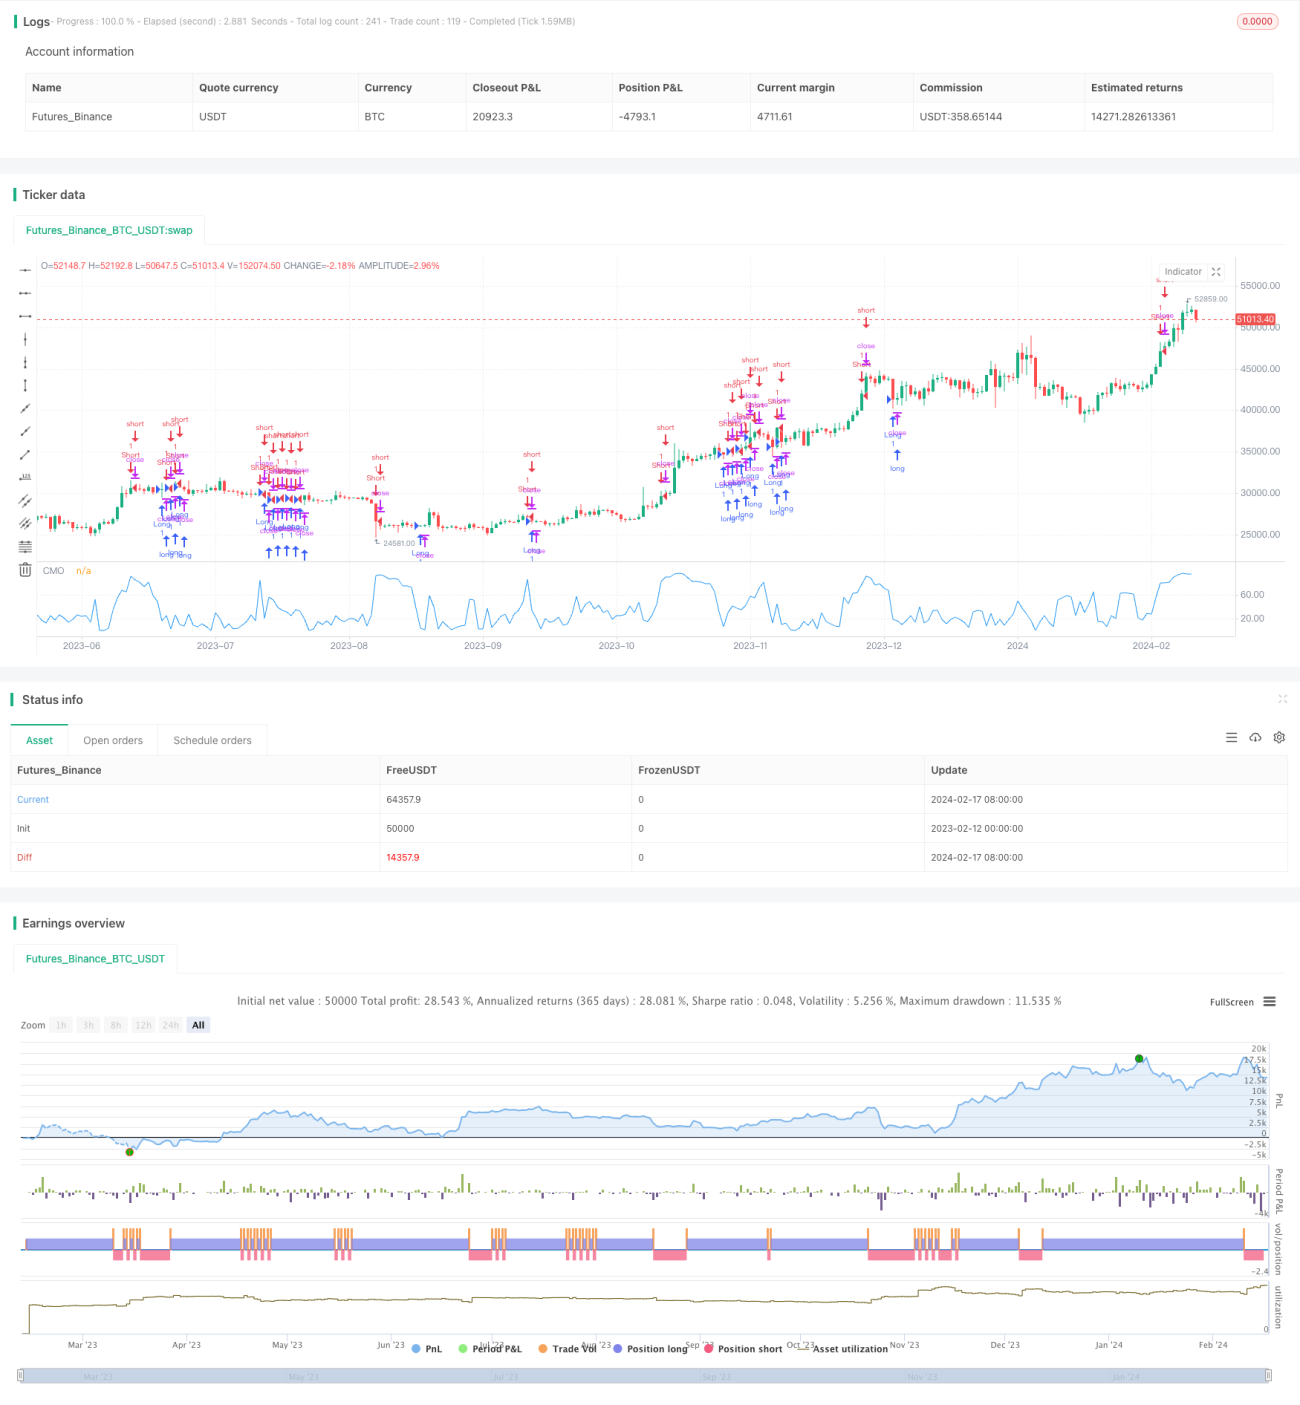
The Absolute Momentum Indicator Strategy is an improved version based on the momentum indicator CMO developed by Tushar Chande. This strategy judges whether the market is currently overbought or oversold by calculating the absolute value of price momentum to capture medium-term price fluctuations in the market.
Strategy Principle
The core indicator of this strategy is the improved CMO indicator, called AbsCMO. The calculation formula of AbsCMO is:
AbsCMO = abs(100 * (latest closing price - closing price Length periods ago) / (simple moving average of absolute price fluctuations over Length period * Length))
Where Length represents the length of averaging period. The range of AbsCMO values is from 0 to 100. This indicator combines directionality and strength of momentum monumentality to clearly determine medium-term market trends and overbought/oversold areas.
When AbsCMO breaks through the specified upper rail (default 70), it indicates the market has entered overbought territory and goes short; when AbsCMO breaks through the specified lower rail (default 20), it indicates the market has entered oversold territory and goes long.
Advantage Analysis
Compared with other momentum indicators, the AbsCMO indicator has the following advantages:
- It reflects the absolute momentum of price and judges medium-term trends more accurately;
- It identifies overbought/oversold conditions more clearly by incorporating directionality and strength;
- Its range is limited between 0-100, making it more suitable for comparison across different products;
- It is less sensitive to short-term volatility, reflecting medium-term trends;
- Customizable parameters make it highly adaptable.
Risk Analysis
The main risks of this strategy are:
- As a medium-term indicator, it is less sensitive to short-term fluctuations;
- The default parameters may not suit all products and need to be optimized;
- Long holding periods can lead to large drawdowns.
These risks could be reduced by shortening holding periods, optimizing parameters, or incorporating other indicators.
Optimization Directions
This strategy can be optimized from the following aspects:
- Optimize the parameters of AbsCMO to adapt to more products;
- Incorporate other indicators to filter false signals;
- Set stop loss and take profit rules to control risks;
- Leverage technologies like deep learning to find better entry points.
Conclusion
In summary, the Absolute Momentum Indicator Strategy is a useful medium-term trading strategy. It reflects the absolute momentum characteristics of price over the medium term and has strong predictive power of medium-term trends. However, this strategy is less sensitive to short-term fluctuations and carries certain risks. Further improvements like parameter optimization, indicator filters, stop loss mechanisms can make its live performance more steady and reliable.
/*backtest
start: 2023-02-12 00:00:00
end: 2024-02-18 00:00:00
period: 1d
basePeriod: 1h
exchanges: [{"eid":"Futures_Binance","currency":"BTC_USDT"}]
*/

//@version=2
////////////////////////////////////////////////////////////
//  Copyright by HPotter v1.0 17/02/2017
// This indicator plots the absolute value of CMO. CMO was developed by Tushar - 1