Price Channel VWAP Trading Strategy

Overview
This strategy is called "Price Channel VWAP Trading Strategy". It is a strategy that implements VWAP trading based on price channels. The main idea of this strategy is: within the price channel, use the moving average line of the VWAP indicator and its upper and lower offset channel lines for buy and sell point judgment. When the channel lines are broken, open positions according to the fixed percentage of the total assets, and close positions when prices regress to the VWAP moving average line.
Strategy Principle
This strategy calculates the current average transaction price through the VWAP indicator. VWAP represents the average price and is the ratio of turnover to trading volume. The VWAP indicator reflects the degree of deviation between the current price and the historical average trading price.
The strategy uses the moving average line of the VWAP indicator and its offset channel lines. The proportions of the offset channel lines are set through the parameters "longlevel1" and "shortlevel1". When the price breaks through the upper offset channel line, open long positions according to the percentage of positions set by the parameter "lotsizelong"; when the price breaks through the lower offset channel line, open short positions according to the percentage of positions set by the parameter "lotsizeshort". After opening positions, choose to close positions when prices regress to around the VWAP moving average line.
The parameter settings of this strategy fully reflect the idea of channel trading. Users can adjust the channel width and size of positions as a percentage of total assets according to their own preferences, thereby realizing different degrees of trading frequency.
Advantage Analysis
This trading strategy has the following advantages:
- Using VWAP indicators to determine value midpoints can capture mainstream market direction
- Trading within channel ranges avoids noise interference for clearer operation
- Combining channels of different levels, deploying in batches reduces risk
- Timely profit taking by regression avoids losses caused by rapid reversals
Since the VWAP indicator can well reflect the average price level, trading based on its channel lines can effectively lock in value midpoints and avoid being biased by short-term fluctuations. At the same time, combining channels with different parameters and building positions in batches can effectively control risks and prevent one-sided risk concentrations resulting in forced liquidations. Finally, by timely profit taking to close positions near the regression of the VWAP moving average line can reduce losses caused by price reversals.
Risk Analysis
This strategy also has some risks to note:
- The VWAP indicator is insensitive to high-frequency trading and cannot reflect extreme price anomalies
- Improper channel width parameter settings may lead to overly aggressive trading
- If the range of regression operations to close positions is too wide, it may cause trapped losses
The VWAP indicator is insensitive to high-frequency trading volatility. In case of extreme price gaps or short-term anomalies, it will still trigger unnecessary trading signals and losses. In addition, if the channel parameters are set too loose, it will easily form invalid price penetration signals. Finally, if the range of positions closing in regression operations is set too wide, it may miss the best timing for profit taking and cause trapped losses.
The countermeasures are to reasonably assess parameter settings and appropriately adjust channel parameters; while combining other indicators to judge price anomalies and avoid blind following signals; finally evaluating parameter optimization of channels of different levels and regression ranges to achieve better profit taking effects.
Optimization Directions
This strategy can be optimized in the following directions:
- Increase the level of channels and optimize parameter combinations
- Combine trading volume indicators to determine the validity of breakthroughs
- Add stop loss strategies and set stop loss by drawdown ratio
More levels of channel lines can be added and parameters combined for optimization to achieve more stable trading effects. In addition, trading volume judgment rules can be added to avoid invalid price gaps causing trading losses. Finally, stop loss rules can also be set so that when the loss of positions reaches a certain percentage, stop loss to exit positions, effectively controlling risks.
Summary
This strategy combines the VWAP indicator with price channels to achieve a relatively stable trading strategy. The strategy parameter settings are flexible for users to adjust according to their own preferences. This strategy can effectively determine the direction of value midpoints. Through parameter combination and batch building of positions, stable profitability can be achieved. Although there is still room for improvement in the strategy, overall it is a quantitative trading strategy with high practicality.
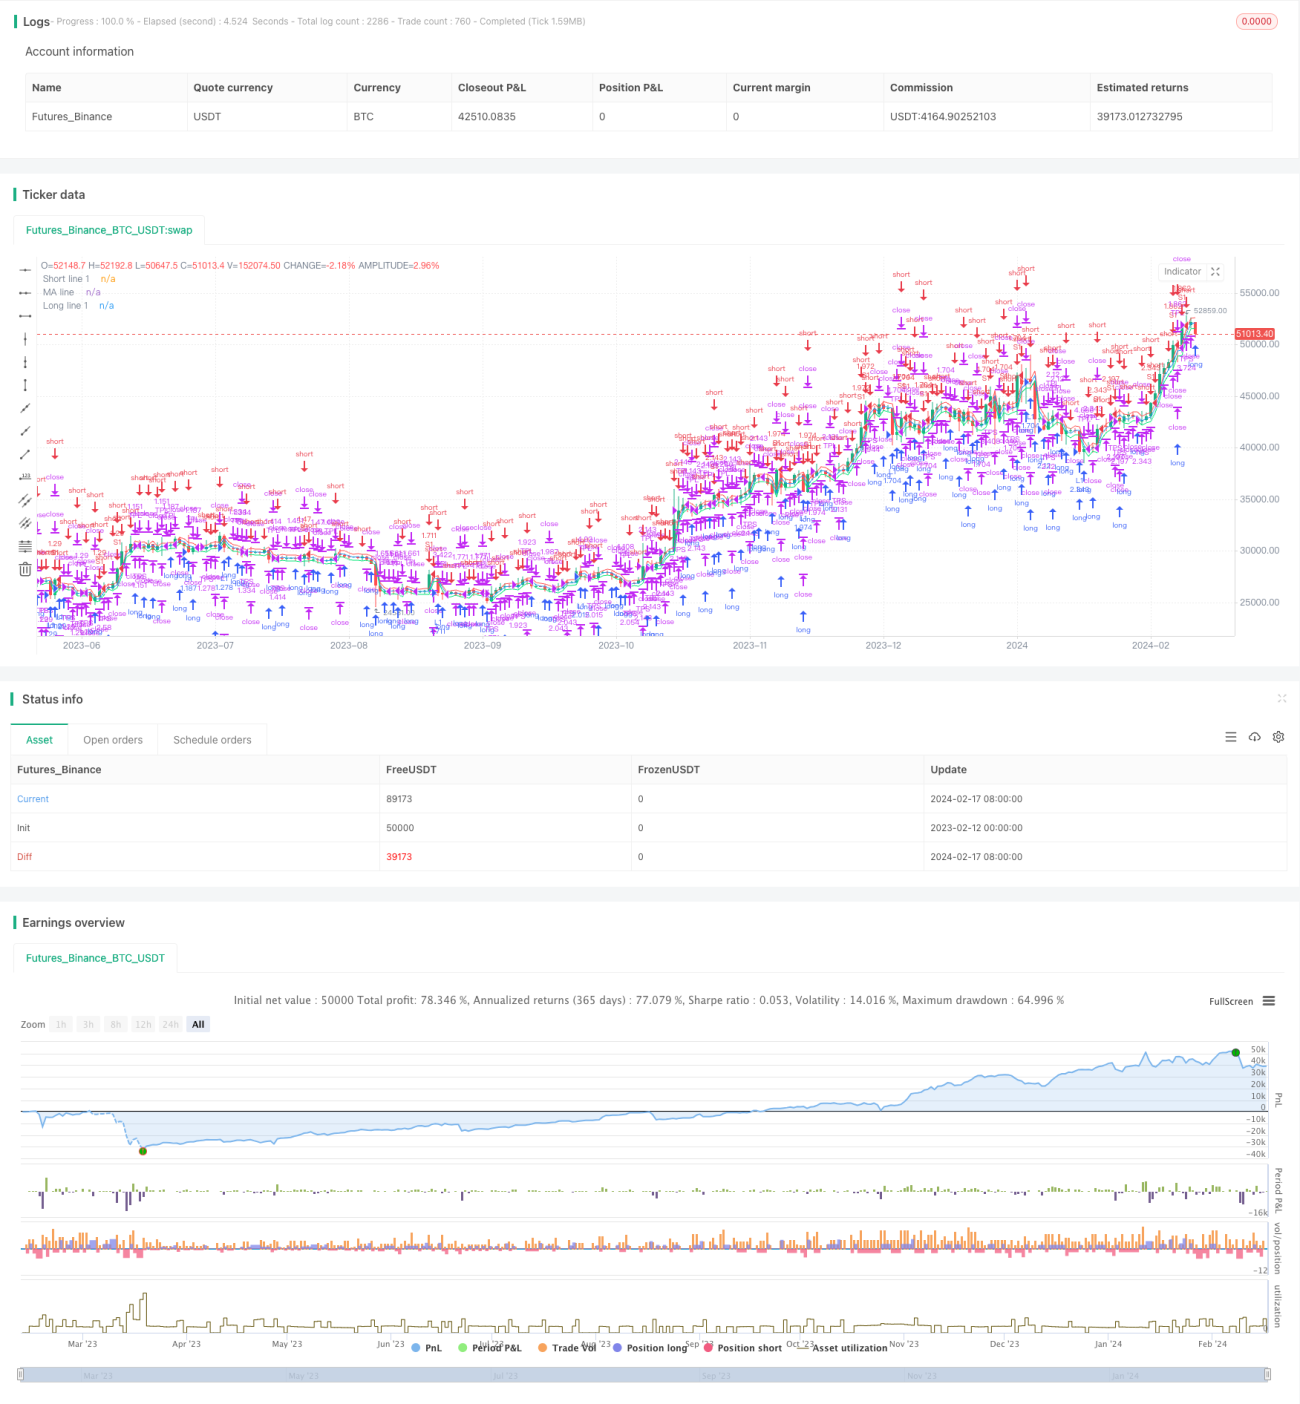
/*backtest
start: 2023-02-12 00:00:00
end: 2024-02-18 00:00:00
period: 1d
basePeriod: 1h
exchanges: [{"eid":"Futures_Binance","currency":"BTC_USDT"}]
*/

//@version=4
strategy(title = "VWAP Bands Backtest", shorttitle = "VWAP Bands Backtest", overlay = true, default_qty_type = strategy.percent_of_equity, default_qty_value = 100, pyramiding = 3)

//Settings- 1