概述
震荡反转CAT策略是一种基于技术指标的量化交易策略。该策略通过MA、EMA等指标判断市场趋势和支持阻力位置,并结合自定义的黑天鹅和白天鹅指标判断异常波动,实现低买高卖的趋势交易策略。
策略原理
震荡反转CAT策略的核心逻辑在于通过MA、EMA等技术指标判断总体趋势,再结合自定义的黑天鹅和白天鹅指标捕捉异常波动机会。具体原理如下:
使用SMA、EMA等指标判断总体趋势方向。例如EMA144上穿EMA169视为看涨信号,EMA144下穿EMA169视为看跌信号。
自定义黑天鹅指标,公式为(收盘价-开盘价)/收盘价。它反映了某根K线的异常波动程度。当黑天鹅指标超过阈值(如0.0191),同时收盘价低于开盘价时,表示发生了向下的异常波动,这是空头交易机会。
自定义白天鹅指标与黑天鹅指标类似,也反映了某根K线的异常波动程度。当白天鹅指标超过阈值,同时收盘价高于开盘价时,表示发生了向上的异常波动,这是多头交易机会。
在捕捉异常波动机会后,会等待EMA等指标发出反转信号时平仓,实现低买高卖。
该策略综合运用均线判断趋势和自定义指标捕捉异常,实现了低买高卖的反转交易,属于较为典型的量化交易策略。
优势分析
震荡反转CAT策略具有以下几个优势:
捕捉异常波动,具有较高的胜率。黑天鹅和白天鹅指标可以有效捕捉价格异常波动,这些波动往往预示着反转,因此交易胜率较高。
确定的入市和出市规则,避免随波逐流。该策略入市和出市标准非常明确,有助于规避交易者的随机性和情绪化操作。
多种参数和指标可供优化调整。如MA和EMA的周期参数、黑天鹅和白天鹅的参数阈值等都可以通过优化调整,使策略更加适应不同品种和交易环境。
适用于高频和低频交易。该策略同时结合了趋势和反转,可配置不同时间周期使用,适用于高频和低频交易场景。
风险控制手段比较完备。策略采用交易百分比方式下单,同时有止损平仓机制,可以有效控制单笔损失。
风险分析
震荡反转CAT策略也存在一定的风险,主要体现在:
参数优化风险。黑天鹅和白天鹅等参数的设定对策略效果有重大影响,如果参数设定不当,则会大幅降低策略盈利水平。
回撤风险。当行情出现较长的单边趋势时,该策略可能会产生一定的连续亏损和较大回撤。
假突破风险。现实中常出现一些短期假突破,如果参数设置太敏感可能导致过多不必要的交易。
针对上述风险,可以采取如下措施加以应对:
建立参数优化机制,利用历史数据进行严格的回测优化,确保参数设置合理。
设置止损机制。合理的止损可以有效控制单笔亏损额度和最大回撤。
调整参数灵敏度。避免参数设置太敏感,增加一定的过滤条件,规避假突破的干扰。
优化方向
震荡反转CAT策略还具有很大的优化空间,主要优化方向有:
对黑天鹅和白天鹅指标进行进一步细化,设置不同参数组合,使其对异常波动的识别更加准确和全面。
增加机器学习算法,利用神经网络或集成学习方法自动优化参数配置,使策略参数动态调整,更好适应市场变化。
利用深度学习技术识别图形形态,辅助判断价格反转信号,提高策略效果。
增加模糊逻辑控制参数灵敏度,在趋势明显时保持参数稳定,趋势转折点时增加参数灵敏度。
结合无参遗传算法、模拟退火算法等全局优化方法,实现多参数的整体优化。
对交易品种进行扩展,增加股票、数字货币等其他品种,进行跨市场套利。
通过系统性的模型和参数优化,震荡反转CAT策略可以进一步增强策略 Robustness,从而获得更出色的交易效果。
总结
震荡反转CAT策略综合运用均线和自定义指标,实现了有效识别市场反转的量化交易策略。该策略具有识别异常波动、默认的入市出市规则、可优化空间大等优势,可以通过参数和模型优化进一步增强策略效果。需要防范的参数优化风险、回撤风险、假突破风险等。总的来说,该策略思路合理,具有很好的实用性。
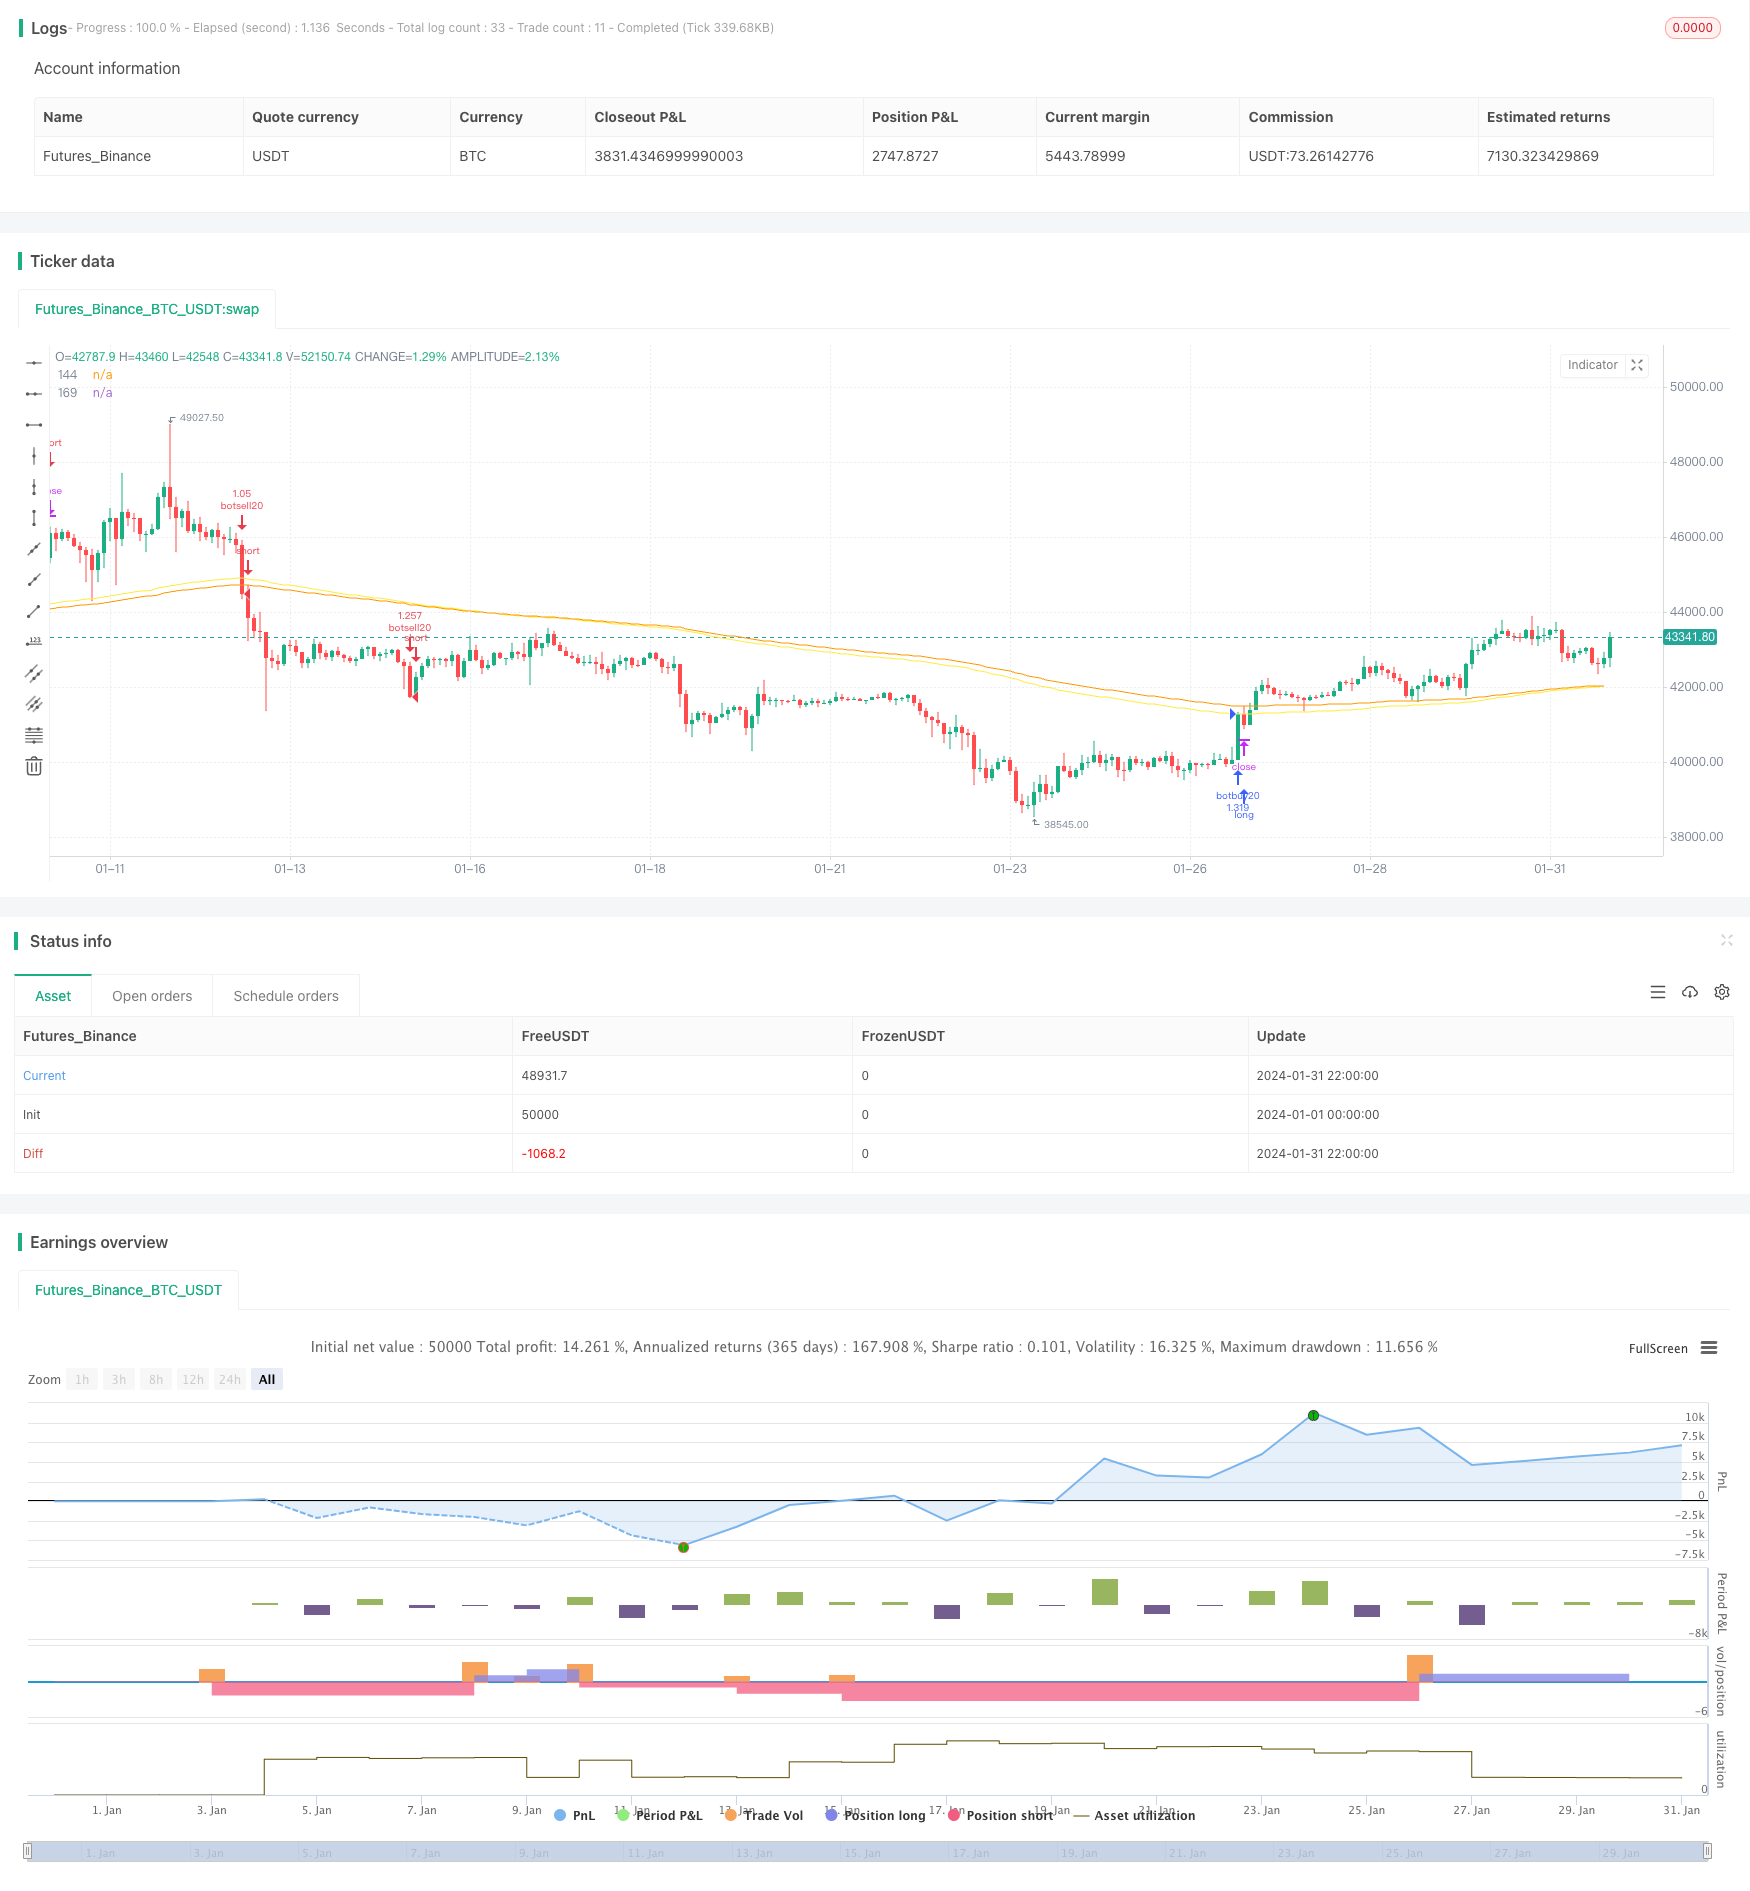
/*backtest
start: 2024-01-01 00:00:00
end: 2024-01-31 23:59:59
period: 2h
basePeriod: 15m
exchanges: [{"eid":"Futures_Binance","currency":"BTC_USDT"}]
*/

//@version=4


//适合1分钟-3分钟的k线,发生波动超过百分之二时,自动报警
strategy("BlackSwan strategy", overlay=true,
         initial_capital=10000, currency='USD', default_qty_type=strategy.percent_of_equity,
         default_qty_value=100, commission_type= strategy.commission.percent, commission_value=0.075,pyramiding=3)
//-------------------------------------------
//-------------------------------------------
timecondition =  timeframe.period =="480"  or timeframe.period =="240" or timeframe.period =="D"  or timeframe.period =="720"
// Make input options that configure backtest date range
startDate = input(title="Start Date", type=input.integer,
     defval=1, minval=1, maxval=31)
startMonth = input(title="Start Month", type=input.integer,
     defval=11, minval=1, maxval=12)
startYear = input(title="Start Year", type=input.integer,
     defval=2018, minval=1800, maxval=2100)
endDate = input(title="End Date", type=input.integer,
     defval=1, minval=1, maxval=31)
endMonth = input(title="End Month", type=input.integer,
     defval=11, minval=1, maxval=12)
endYear = input(title="End Year", type=input.integer,
     defval=2031, minval=1800, maxval=2100)
// Look if the close time of the current bar
// falls inside the date range
inDateRange = (time >= timestamp(syminfo.timezone, startYear,
         startMonth, startDate, 0, 0)) and
     (time < timestamp(syminfo.timezone, endYear, endMonth, endDate, 0, 0))


// Inputs
a = input(1,     title = "Key Vaule. 'This changes the sensitivity'")
c = input(10,    title = "ATR Period")
h = input(false, title = "Signals from Heikin Ashi Candles")


ma60 = sma(close,60)
ema144 = ema(close,144)

ema169 = ema(close,169)
ma20=sma(close,20)


plot(ema144,color=color.yellow, title="144")
plot(ema169,color=color.orange, title="169")


heitiane=(close-open)
heitiane:=abs(heitiane)
heitiane:=heitiane/close

if (inDateRange and  heitiane >0.0191 and close<open) //  and close>f3
    strategy.entry("botsell20", strategy.short, comment = "黑天鹅追空"+tostring(heitiane))

if(crossover(ema144,ema169))
    strategy.close("botsell20", comment = "平空")
if (inDateRange and  heitiane >0.0191 and close>open) //  and close>f3
    strategy.entry("botbuy20", strategy.long, comment = "白天鹅追多"+tostring(heitiane))

if(crossunder(ema144,ema169))
    strategy.close("botbuy20", comment = "平多")