Bugra Trading Strategy Based on Dual Kinetic Moving Average

Overview
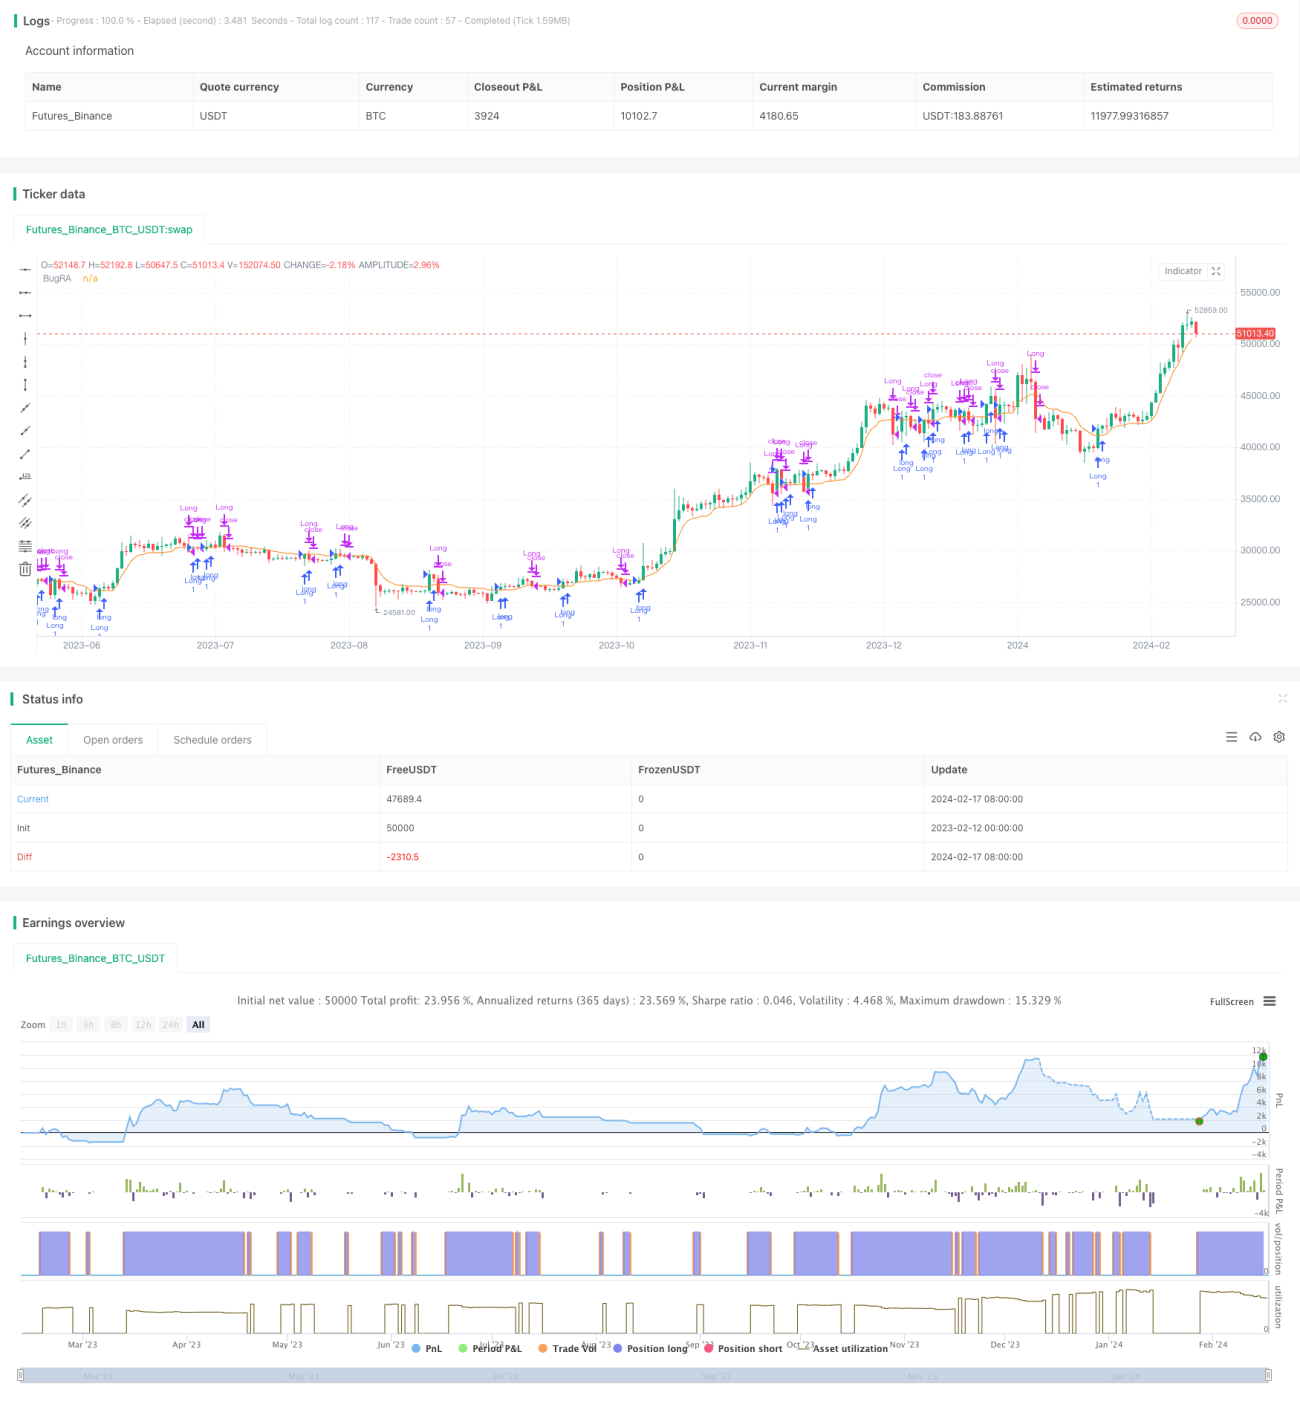
The Bugra trading strategy is a strategy that combines the OTT indicator developed by my dear teacher Anıl Özekşi and the Wavetrend Oscillator indicator by lonestar108. It forms a successful trading indicator by integrating the two indicators. The strategy can do long and short trading in two-way markets.
Strategy Principle
The Bugra trading strategy first calculates the midline of Bollinger Bands, which is the moving average line MAvg. Then, based on the percentage range and period set by the user, it calculates the long stop loss longStop and the short stop loss shortStop. When the price breaks through the upper rail, go long. When it breaks through the lower rail, go short. The closing signal is when the price returns to around the moving average.
Specifically, the core indicator of this strategy is the OTT indicator. The OTT indicator consists of a moving average and boundary lines. It adjusts the position of the boundary lines according to the volatility of the market based on certain algorithms. When the price breaks through the lower boundary line OTT, go short. When it breaks through the upper boundary line OTT, go long.
This strategy also uses the Wavetrend indicator to determine the direction of the price trend. If it is judged to be a downward trend, only go short, not long. If it is judged to be an upward trend, only go long, not short.
Advantage Analysis
The Bugra trading strategy combines the advantages of moving averages, Bollinger Bands and OTT indicators. It can automatically adjust stop loss positions and reduce the probability of stop loss being triggered. At the same time, by incorporating trend judgment indicators, it avoids being trapped in oscillating trends.
Specifically, the main advantages of this strategy are:
- It can automatically adjust stop loss positions to effectively control risks.
- The OTT indicator can relatively accurately determine reversal points.
- By incorporating trend judgment indicators, it avoids being trapped in oscillating markets.
- Its rules are relatively simple and clear, easy to understand and apply.
Risk Analysis
The Bugra trading strategy also has some risks, mainly in the following aspects:
- In violent market conditions, stop loss may be broken, causing greater losses.
- The reversal signals judged by the OTT indicator may not be accurate, and faulty signals may occur.
- Trend judgments can also be wrong. Going long in an downward oscillation will cause losses.
- Improper parameter settings will also affect strategy performance.
The countermeasures are mainly:
- Appropriately loosen the stop loss range to ensure that stop loss lines are not easily activated.
- Combine with other indicators to judge the reliability of OTT signals to avoid false signals.
- Appropriately adjust parameters to make trend judgments more reliable.
- Optimize parameters to find the best parameter combination.
Optimization Directions
There is still room for further optimization of the dual kinetic moving average trading strategy:
- Consider combining with other indicators to improve the accuracy of signal judgment.
- Study adaptive stop loss algorithms so that stop loss lines can be adjusted according to market volatility.
- Add trading volume indicators to avoid false breakouts with low volume.
- Test different types of moving averages to find the most suitable moving average.
- Try machine learning and other methods to automatically optimize parameters.
Summary
The dual kinetic moving average trading strategy integrates the advantages of multiple indicators. It can automatically adjust stop loss positions, judge reversal signals, and identify trend directions. It has advantages such as strong risk control capabilities and easy to understand and use. But it also has risks like being trapped and inaccurate signals. This strategy can be further optimized by combining with other indicators, studying adaptive algorithms, etc. In general, the dual kinetic moving average trading strategy is a practical breakout trading strategy.
- 1