概述
本策略的核心思想是结合RSI指标和移动平均线,寻找股票价格反转机会,实现低买高卖。当RSI指标显示股票处于超卖状态,且短期移动平均线下穿价格时,作为买入信号;设置止损和止盈后,等待价格反转上涨。
策略原理
该策略主要利用RSI指标判断超卖超买,及移动平均线的金叉死叉判断价格趋势。具体来说,RSI指标可以有效判断股票是否超卖或超买。当RSI低于30时,属于超卖范围。而当短期移动平均线(该策略中设置为9日线)下穿价格时,说明价格在下跌。
所以,当RSI指标低于40,即接近超卖状态,且9日移动平均线下穿价格时,可以判断为股票价格可能反转的时机,做多买入。随后设置止损和止盈退出,等待股票价格反转上涨后套现获得利润。
优势分析
该策略结合RSI指标和移动平均线,可以有效判断买入时机。相比单一判断超卖,增加了移动平均线的条件判定,避免超卖区域波动。止损止盈设置灵活,可以因人而异。
风险分析
该策略依赖参数设置,如RSI judgment阈值,移动平均线时间窗口等,不同参数可能带来不同结果。且在特定市场情况下,仍有可能出现止损。
此外,交易费用也会对利润产生一定影响。后期可以考虑加入交易量或资金管理模块,进行优化。
优化方向
可以考虑动态调整移动平均线参数,不同周期选择不同的参数;或引入其他指标判断,如KDJ、MACD等,形成多种条件综合判定。
另外也可以建立交易量或资金管理模块,以控制单笔交易占用资金比例,减少单笔损失的影响。
总结
该策略整体来说,利用RSI指标和移动平均线判定买入时机,可以有效判断价格反转,在超卖时买入,获得比较高的成功率。结合止损止盈来锁定利润,可以获取较好的效果。后期优化的方向,可以考虑加入更多指标或建立额外的交易/资金管理模块,使策略更加强大。
策略源码
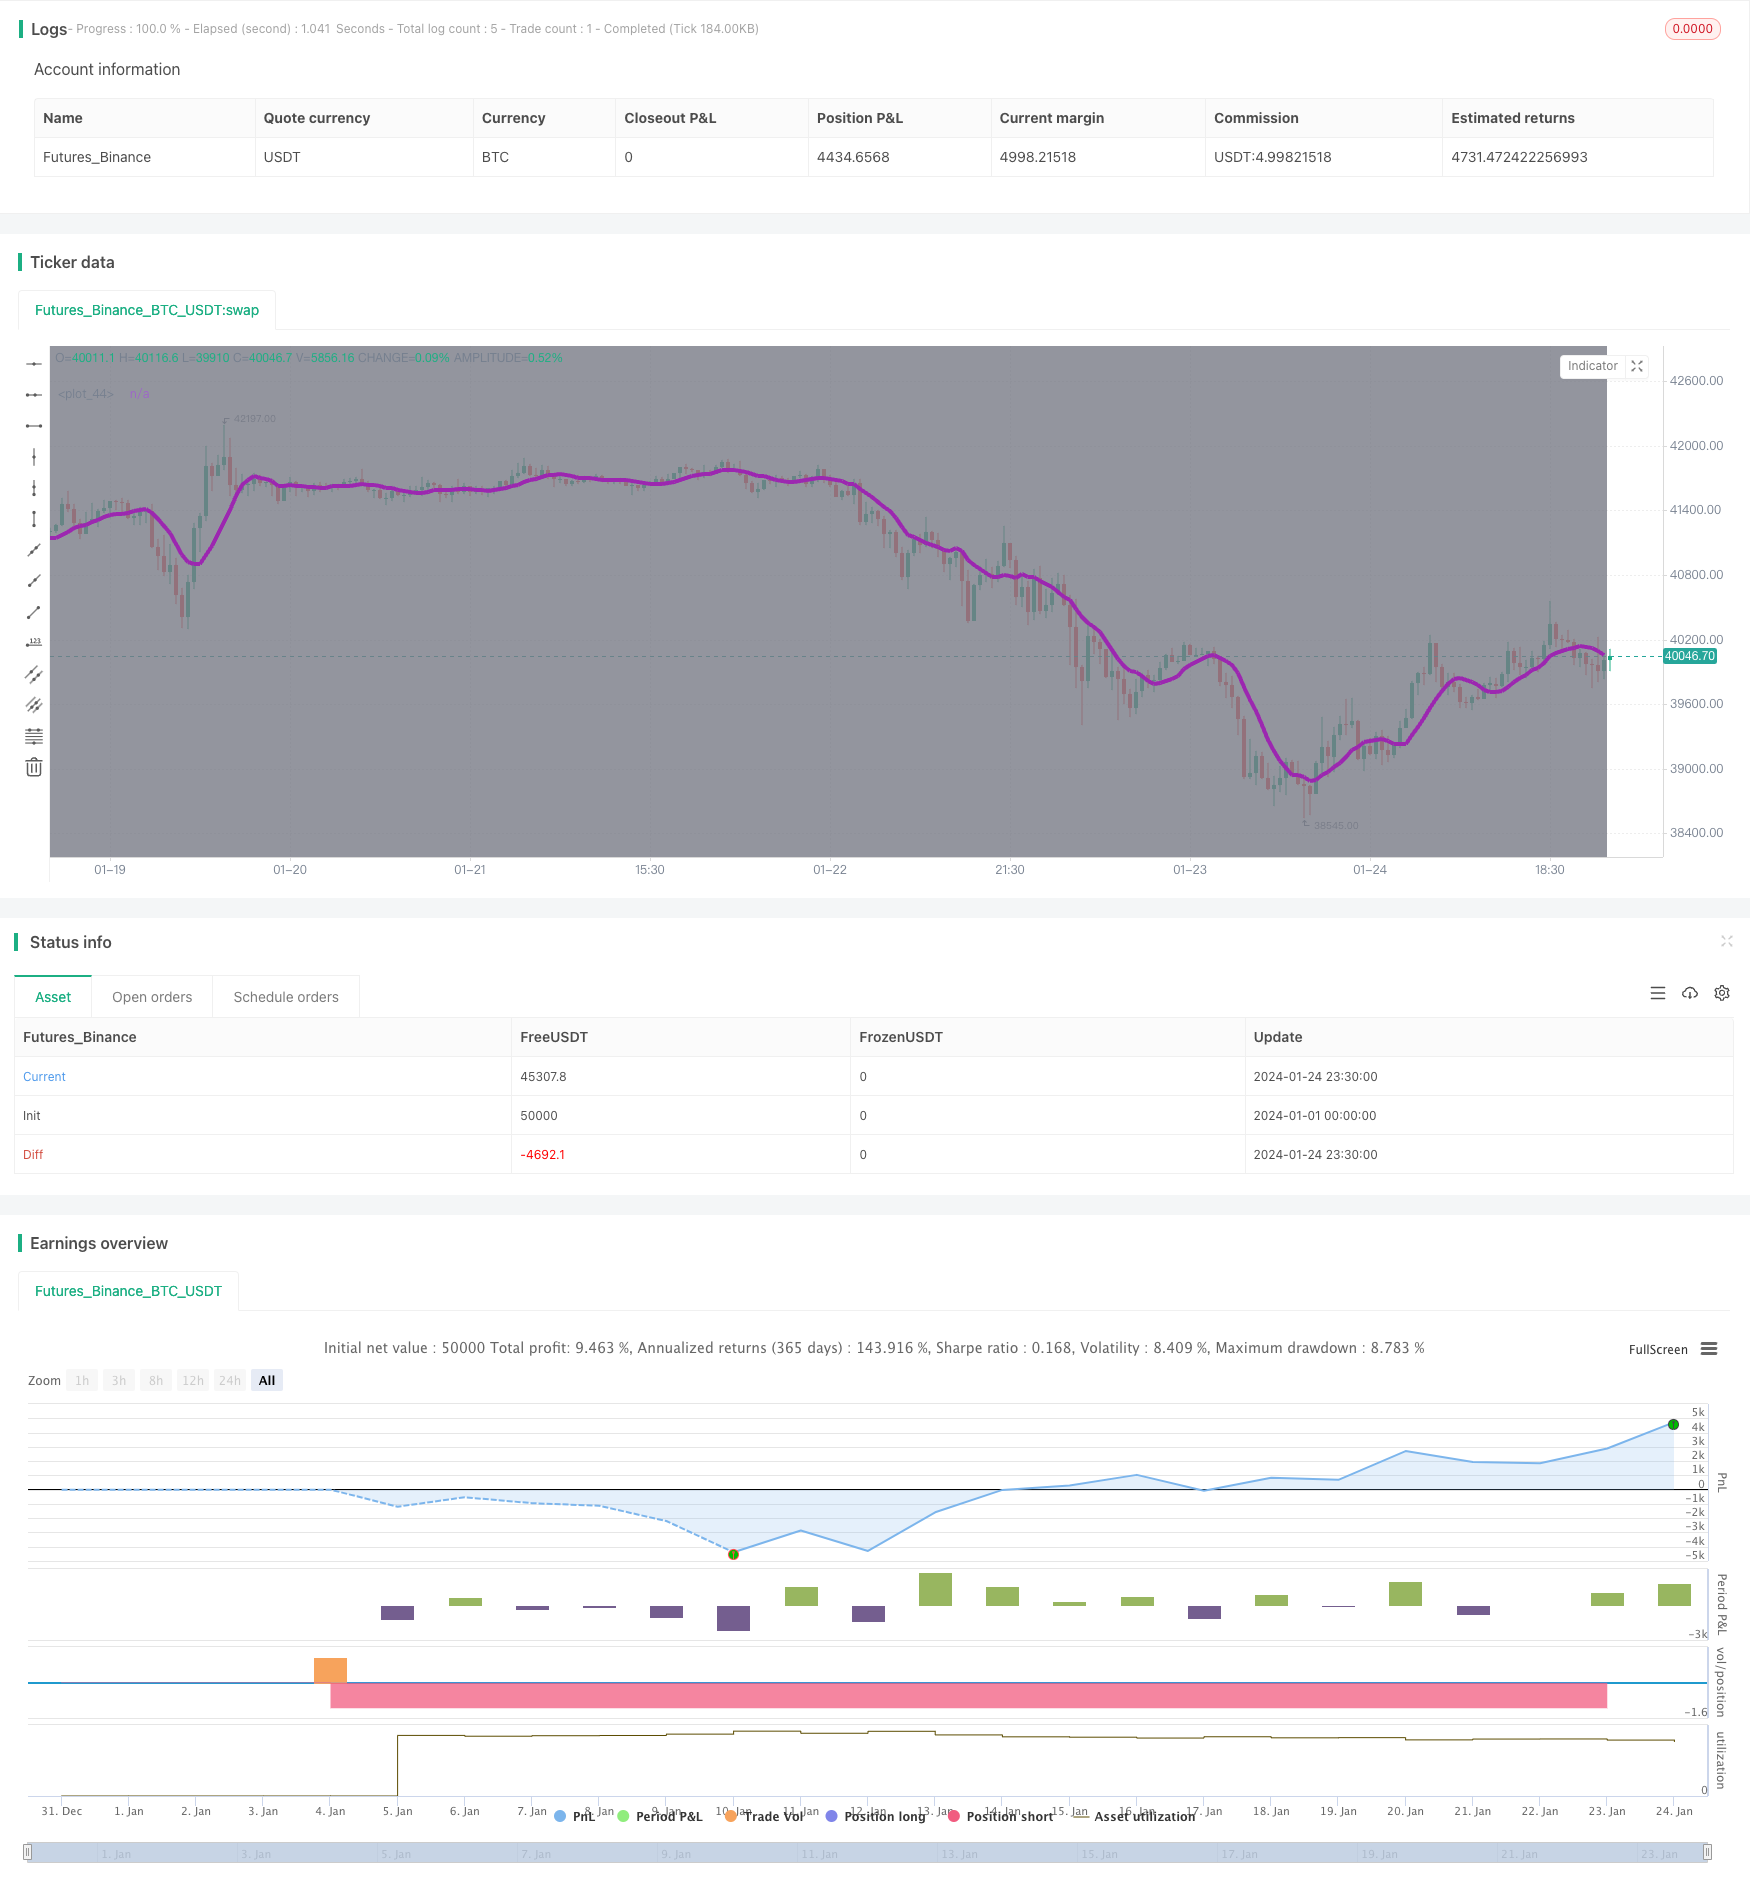
/*backtest
start: 2024-01-01 00:00:00
end: 2024-01-24 23:59:59
period: 30m
basePeriod: 15m
exchanges: [{"eid":"Futures_Binance","currency":"BTC_USDT"}]
*/

// This source code is subject to the terms of the Mozilla Public License 2.0 at https://mozilla.org/MPL/2.0/
// © Coinrule

//@version=4
strategy(shorttitle='MARSI',title='Moving Average', overlay=true, initial_capital=1000,  default_qty_type = strategy.percent_of_equity, default_qty_value = 100)

//Backtest dates
fromMonth = input(defval = 1,    title = "From Month",      type = input.integer, minval = 1, maxval = 12)
fromDay   = input(defval = 1,    title = "From Day",        type = input.integer, minval = 1, maxval = 31)
fromYear  = input(defval = 2020, title = "From Year",       type = input.integer, minval = 1970)
thruMonth = input(defval = 1,    title = "Thru Month",      type = input.integer, minval = 1, maxval = 12)
thruDay   = input(defval = 1,    title = "Thru Day",        type = input.integer, minval = 1, maxval = 31)
thruYear  = input(defval = 2112, title = "Thru Year",       type = input.integer, minval = 1970)

showDate  = input(defval = true, title = "Show Date Range", type = input.bool)

start     = timestamp(fromYear, fromMonth, fromDay, 00, 00)        // backtest start window
finish    = timestamp(thruYear, thruMonth, thruDay, 23, 59)        // backtest finish window
window()  => true

//MA inputs and calculations
inshort=input(9, title='MA short period')
MAshort= sma(close, inshort)

// RSI inputs and calculations
lengthRSI = input(14, title = 'RSI period', minval=1)
RSI = rsi(close, lengthRSI)

//Entry
strategy.entry(id="long", long = true, when = MAshort<close and RSI<40 and window())

//Exit
longLossPerc = input(title="Long Stop Loss (%)",
     type=input.float, minval=0.0, step=0.1, defval=1.5) * 0.01
longTakePerc = input(title="Long Take Profit (%)",
     type=input.float, minval=0.0, step=0.1, defval=3) * 0.01
longSL  = strategy.position_avg_price * (1 - longLossPerc)
longTP  = strategy.position_avg_price * (1 + longTakePerc)
if (strategy.position_size > 0 and window())
    strategy.exit(id="TP/SL", stop=longSL, limit=longTP)


bgcolor(color = showDate and window() ? color.gray : na, transp = 90)
plot(MAshort, color=color.purple, linewidth=4)