Adaptive Zero Lag Exponential Moving Average Quantitative Trading Strategy

Author: ChaoZhang, Date: 2024-02-19 15:38:02
Tags:

img

Overview

The Adaptive Zero Lag Exponential Moving Average Quantitative Trading Strategy is a quantitative trading strategy developed based on John Ehlers’s idea of Zero Lag Exponential Moving Average (ZLEMA). This strategy uses the exponential moving average as a baseline indicator and incorporates an adaptive method of Instantaneous Frequency Measurement (IFM) to dynamically optimize the period parameter of the exponential moving average.

Strategy Logic

The core idea of this strategy originates from John Ehlers’s theory of zero lag filters. Although the exponential moving average is a widely known technical indicator, it inherently has the problem of lagging. Ehlers introduces an error correction factor in the calculation formula of the exponential moving average to effectively eliminate the lagging phenomenon, making the Zero Lag EMA more sensitive in tracking price changes.

In the Adaptive Zero Lag EMA strategy, we utilize the instantaneous frequency measurement methods to adaptively optimize the period parameter of the ZLEMA. The IFM consists of two techniques - the Cosine method and the Inphase-Quadrature method, which can measure the dominant cycle of price oscillation. By real-time tracking of the optimal periods calculated by these two measurements, we dynamically set the period parameter of the ZLEMA to better suit the current market condition.

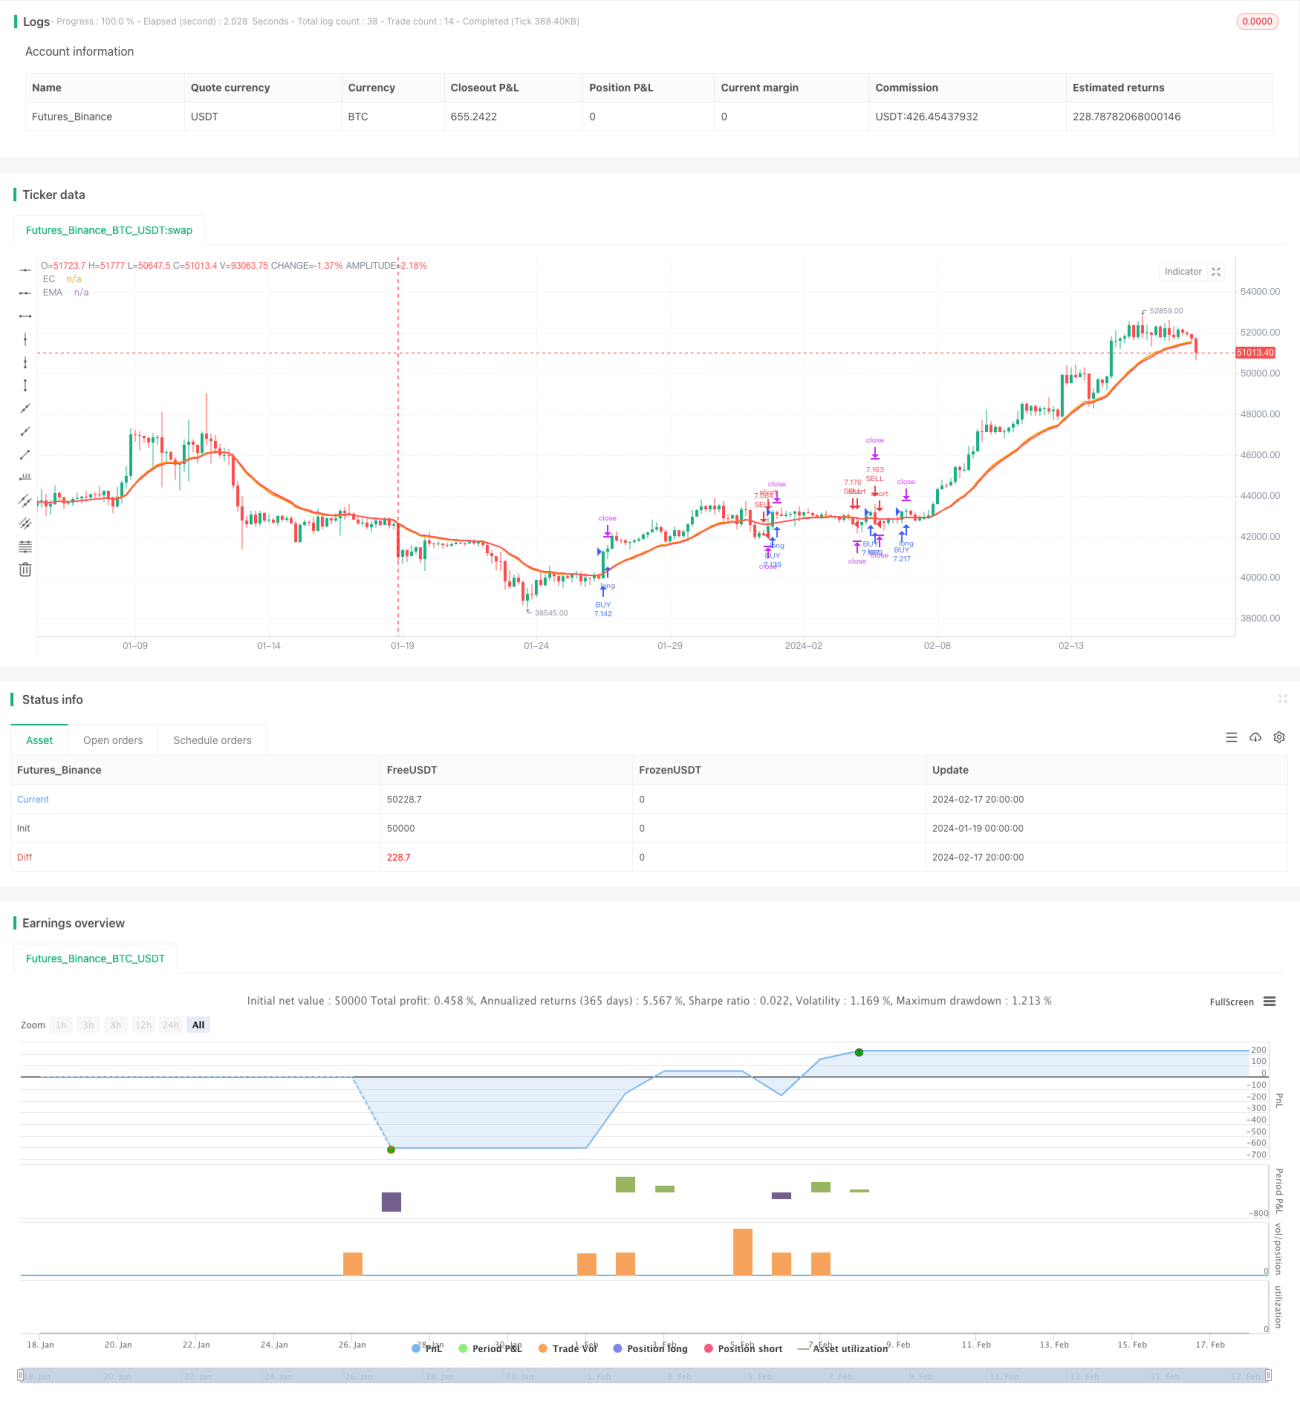
When the fast EMA (ZLEMA) crosses over the slow EMA from below, a long signal is generated. When the fast EMA crosses below the slow EMA, a short signal is triggered. This forms a trading strategy similar to the moving average crossover system.

Advantages

The Adaptive Zero Lag EMA strategy combines the zero lag filter and adaptive period optimization, with the following advantages:

  1. Eliminates lagging and makes more sensitive signals
  2. Adaptive period parameter for a wide range of markets
  3. Fewer parameters easy for testing and optimization
  4. Configurable fixed SL/TP for better risk control

Risks

There are also some risks in this strategy:

  1. The adaptive optimized period may fail in certain market environments
  2. Improper fixed SL/TP settings could lead to oversized loss or missed profit
  3. Insufficient parameter optimization tests can lead to poor live performance

To control these risks, we need to fully test the parameters across different market conditions, adjust the SL/TP properly, and simulate the live trading environment in backtests.

Optimization Directions

There is still ample room to further optimize this strategy:

  1. Alternative adaptive period measurement methods, e.g. volatility adjusted MA
  2. Additional filter conditions like volume, MA pairings etc.
  3. Enhanced SL/TP techniques, e.g. trailing stops or Chandelier Exit
  4. Dynamic position sizing coupled with risk management
  5. Multiple timeframe confirmation to improve signal quality

Through these optimization means, there is potential to further improve the win rate, profitability, risk-adjusted metrics of the strategy.

Conclusion

The Adaptive Zero Lag EMA strategy successfully combines the zero lag filter and dynamic period optimization. With fewer parameters and easy to operate, it is especially suitable for trending markets. Together with proper stop loss, position sizing and other risk management techniques, its stability and profitability can be further enhanced. There remains ample potential to optimize this strategy for even better performance.


/*backtest
start: 2024-01-19 00:00:00
end: 2024-02-18 00:00:00
period: 4h
basePeriod: 15m
exchanges: [{"eid":"Futures_Binance","currency":"BTC_USDT"}]
*/

//@version=3
strategy(title="Adaptive Zero Lag EMA v2", shorttitle="AZLEMA", overlay = true)

src = input(title="Source",  defval=close)
Period = input(title="Period",  defval = 20)
adaptive = input(title="Adaptive Method", options=["Off", "Cos IFM", "I-Q IFM", "Average"], defval="Off")
GainLimit = input(title="Gain Limit",  defval = 10)
Threshold = input(title="Threshold", type = float, defval=0.05, step=0.01)
fixedSL = input(title="SL Points", defval=70)
fixedTP = input(title="TP Points", defval=5)
risk = input(title='Risk', defval=0.01, step=0.01)

//##############################################################################
//I-Q IFM
//#############################################################################
range = input(title="Max Period",  defval=60, minval=8, maxval=100)

PI = 3.14159265359
imult = 0.635
qmult = 0.338
inphase = 0.0
quadrature = 0.0
re = 0.0
im = 0.0
deltaIQ = 0.0
instIQ = 0.0
lenIQ = 0.0
V = 0.0

P = src - src[7]
inphase := 1.25*(P[4] - imult*P[2]) + imult*nz(inphase[3])
quadrature := P[2] - qmult*P + qmult*nz(quadrature[2])
re := 0.2*(inphase*inphase[1] + quadrature*quadrature[1]) + 0.8*nz(re[1])
im := 0.2*(inphase*quadrature[1] - inphase[1]*quadrature) + 0.8*nz(im[1])
if (re!= 0.0)
    deltaIQ := atan(im/re)
for i=0 to range
    V := V + deltaIQ[i]
    if (V > 2*PI and instIQ == 0.0)
        instIQ := i
if (instIQ == 0.0)
    instIQ := nz(instIQ[1])
lenIQ := 0.25*instIQ + 0.75*nz(lenIQ[1])

//##############################################################################
//COSINE IFM
//#############################################################################
s2 = 0.0
s3 = 0.0
deltaC = 0.0
instC = 0.0
lenC = 0.0
v1 = 0.0
v2 = 0.0
v4 = 0.0

v1 := src - src[7]
s2 := 0.2*(v1[1] + v1)*(v1[1] + v1) + 0.8*nz(s2[1])
s3 := 0.2*(v1[1] - v1)*(v1[1] - v1) + 0.8*nz(s3[1])
if (s2 != 0)
    v2 := sqrt(s3/s2)
if (s3 != 0)
    deltaC := 2*atan(v2)
for i = 0 to range
    v4 := v4 + deltaC[i]
    if (v4 > 2*PI and instC == 0.0)
        instC := i - 1
if (instC == 0.0)
    instC := instC[1]
lenC := 0.25*instC + 0.75*nz(lenC[1])

if (adaptive == "Cos IFM")
    Period := round(lenC)
if (adaptive == "I-Q IFM")
    Period := round(lenIQ)
if (adaptive == "Average")
    Period := round((lenC + lenIQ)/2)

//##############################################################################
//ZERO LAG EXPONENTIAL MOVING AVERAGE
//##############################################################################
LeastError = 1000000.0
EC = 0.0
Gain = 0.0
EMA = 0.0
Error = 0.0
BestGain = 0.0

alpha =2/(Period + 1)
EMA := alpha*src + (1-alpha)*nz(EMA[1])

for i = -GainLimit to GainLimit
    Gain := i/10
    EC := alpha*(EMA + Gain*(src - nz(EC[1]))) + (1 - alpha)*nz(EC[1])
    Error := src - EC
    if(abs(Error)<LeastError)
        LeastError := abs(Error)
        BestGain := Gain

EC := alpha*(EMA + BestGain*(src - nz(EC[1]))) + (1-alpha)*nz(EC[1])

plot(EC, title="EC", color=orange, linewidth=2)
plot(EMA, title="EMA", color=red, linewidth=2)

buy = crossover(EC,EMA) and 100*LeastError/src > Threshold
sell = crossunder(EC,EMA) and 100*LeastError/src > Threshold
strategy.initial_capital = 50000
if (time>timestamp(2016, 1, 1 , 0, 0))
    //LONG
    balance = strategy.initial_capital + strategy.netprofit
    lots = ((risk * balance)/fixedSL)*1
    strategy.entry("BUY", strategy.long, qty=lots, oca_name="BUY",  when=buy)
    strategy.exit("B.Exit", "BUY", qty_percent = 100, loss=fixedSL, trail_offset=15, trail_points=fixedTP)
    //SHORT
    strategy.entry("SELL", strategy.short, qty=lots, oca_name="SELL", when=sell)
    strategy.exit("S.Exit", "SELL", qty_percent = 100, loss=fixedSL, trail_offset=15, trail_points=fixedTP)


More