概述
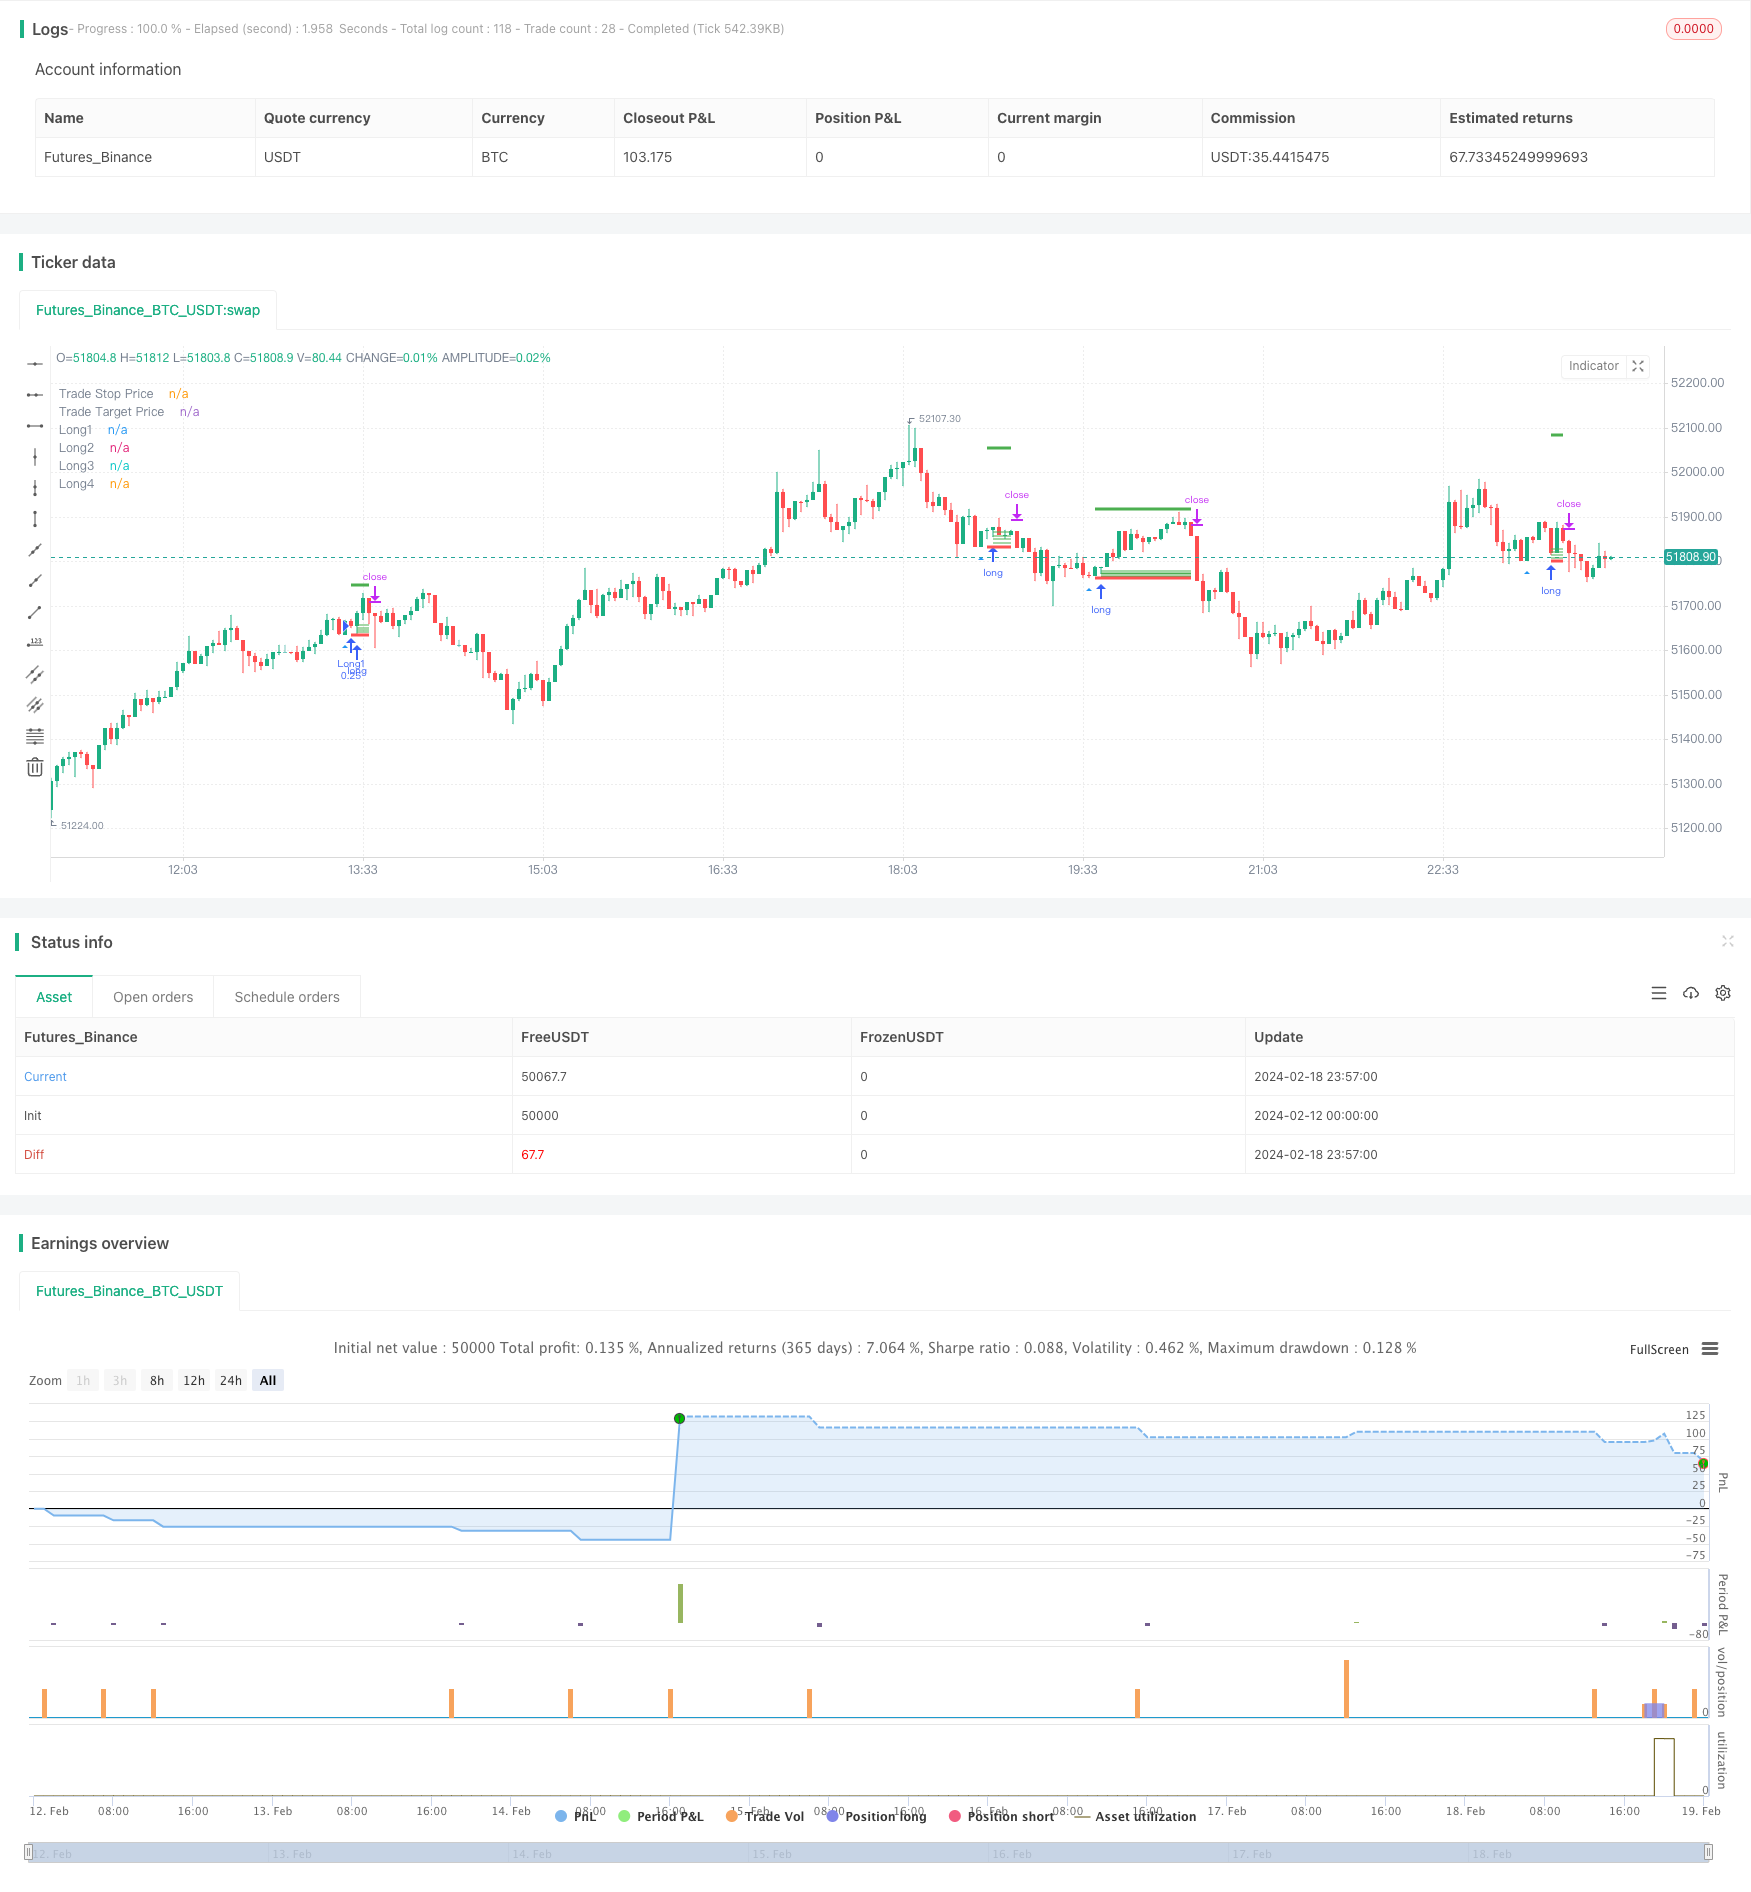
双重底部反转均线DCA网格策略主要应用均线价格反转和DCA策略实现网格逐步建仓。它根据双重底部反转形态来判断反转机会。一旦触发反转形态后,使用多个不同价格的委托单,结合DCA建立逐步网格仓位。
策略原理
该策略首先判断K线是否出现连续两个收盘价相等的底部,这被称为“双重底”。如果检测到双重底,则认为可能出现价格反转机会。此时,策略会在底部附近设置多笔限价委托单,这些委托单的价格会按照ATR和波动率计算,形成一个网格区间。这实现了DCA的效果,可以让交易者在反转后的不同价格点逐步建仓。
具体来说,首先通过ta.atr计算最近14根K线的ATR指标,然后结合最近5根K线计算价格波动率,这是用来确定网格区间的主要参数。网格区间分为4个价格点,分别是底部价格+波动率、底部价格+0.75倍波动率,以此类推。当触发双重底条件后,按这个计算公式在对应价格设置4笔限价委托单,每笔数量相等。未成交的挂单会在设置的蜡烛数后自动撤单。
此外,策略还会设置止损位和止盈位。止损价格为双重底的最低价-最小跳动位,止盈价格为入场价+ATR指标的5倍。当仓位不为0时,这两个价格会实时更新。
优势分析
该策略具有以下优势:
- 利用双重底判断反转时点,可以有效避免假突破。
- DCA网格设计让交易者能以不同价格逐步建仓,降低仓位成本。
- ATR和波动率参数可以动态调整网格和止盈空间,适应市场变化。
- 自动止损机制可以有效控制单笔损失。
风险分析
主要风险有:
- 价格可能不会反转,直接跌破双重底支持位。此时止损会被触发,造成损失。可以适当拉大止损距离。
- DCA网格区间设定不当,大部分委托无法成交。可以测试不同参数,确保成交率。
- 市场震荡剧烈时,止盈可能会被频繁触发。可以考虑适当扩大止盈倍数。
优化方向
该策略还可以从以下几个方向进行优化:
- 增加趋势判断,只在看多趋势中进行反转操作,避免错过大趋势。
- 考虑加大首单仓位,后续网格仓位逐步减小,优化资金使用效率。
- 测试不同的参数组合,找到最佳参数。也可以设计动态参数,根据市场实时调整。
- 可以在高级平台中集成机器学习,实现参数的自动优化。
总结
双重底部反转均线DCA网格策略综合运用了价格形态、均线指标、网格交易等多种技术手段。它具有判断时点精准、成本可控、回撤有保护等优点。该策略优化空间还很大,值得深度研究与应用。如果参数调整得当,在震荡行情中可以获得不错的效果。
策略源码
/*backtest
start: 2024-02-12 00:00:00
end: 2024-02-19 00:00:00
period: 3m
basePeriod: 1m
exchanges: [{"eid":"Futures_Binance","currency":"BTC_USDT"}]
*/

// This source code is subject to the terms of the Mozilla Public License 2.0 at https://mozilla.org/MPL/2.0/
// © cherepanovvsb

//@version=5
strategy("Reversal (only long)", overlay=true, margin_long=1, margin_short=1,initial_capital=1000,commission_type = strategy.commission.percent,commission_value =0.1,currency='USD', process_orders_on_close=true)
plotshape(low == low[1], style=shape.triangleup, location=location.belowbar, color=color.blue, title="1 Setup")
plotshape(low == low[1] and low[1]==low[2], style=shape.triangleup, location=location.belowbar, color=color.red, title="Triple Setup")

ATRlenght   = input.int(title="ATR length for taking profit", defval=14, group="Strategy Settings")
rewardMultiplier= input.int(title="ATR multiplier", defval=5, group="Strategy Settings")
Volatility_length=input.int(title='Volatility length',defval=5,group="Strategy Settings")
Volatility_multiplier=input.float(title='Volatility multiplier',defval=0.5,step=0.1, group="Strategy Settings")
Candles_to_wait=input.int(title='How many candles to wait after placing orders grid?',defval=4,group="Strategy Settings")

// Get ATR
atr1 = ta.atr(ATRlenght)

//Get volatility values (not ATR)
float result = 0
for i = 0 to Volatility_length
	result+=high[i]-low[i]
volatility=result*Volatility_multiplier/Volatility_length

//Validate entrance points
validlow =  low [2]== low[1] and not na(atr1)
validlong = validlow and strategy.position_size == 0  and low[1]<low


// Calculate SL/TP
longStopPrice = low[1]-syminfo.mintick
longStopDistance = close - longStopPrice
longTargetPrice = close + (longStopDistance * rewardMultiplier)
strategy.initial_capital = 50000
//Assign all variables
var tradeStopPrice = 0.0
var tradeTargetPrice = 0.0
var point1=0.0
var point2=0.0
var point3=0.0
var point4=0.0
var contracts = int(strategy.initial_capital/close)/4
if validlong
    tradeStopPrice := longStopPrice
    tradeTargetPrice := longTargetPrice
    point1:=low[1]+volatility
    point2:=low[1]+volatility*0.75
    point3:=low[1]+volatility*0.5
    point4:=low[1]+volatility*0.25

strategy.entry ("Long1", strategy.long,limit=point1,qty=contracts, when=validlong)
strategy.entry ("Long2", strategy.long,limit=point2,qty=contracts, when=validlong)
strategy.entry ("Long3", strategy.long,limit=point3,qty=contracts, when=validlong)
strategy.entry ("Long4", strategy.long,limit=point4,qty=contracts, when=validlong)

stopcondition = ta.barssince(validlong) == Candles_to_wait

strategy.cancel("Long1",when=stopcondition)
strategy.cancel("Long2",when=stopcondition)
strategy.cancel("Long3",when=stopcondition)
strategy.cancel("Long4",when=stopcondition)

strategy.exit(id="Long Exit", limit=tradeTargetPrice, stop=tradeStopPrice, when=strategy.position_size > 0)

plot(strategy.position_size != 0 or validlong ? tradeStopPrice : na, title="Trade Stop Price", color=color.red, style=plot.style_linebr, linewidth=3)
plot(strategy.position_size != 0 or validlong ? tradeTargetPrice : na, title="Trade Target Price", color=color.green, style=plot.style_linebr, linewidth=3)

plot(strategy.position_size != 0? point1 : na, title="Long1", color=color.green, style=plot.style_linebr, transp=0)
plot(strategy.position_size != 0? point2 : na, title="Long2", color=color.green, style=plot.style_linebr, transp=0)
plot(strategy.position_size != 0? point3 : na, title="Long3", color=color.green, style=plot.style_linebr, transp=0)
plot(strategy.position_size != 0? point4 : na, title="Long4", color=color.green, style=plot.style_linebr, transp=0)