Ichimoku Cloud Oscillator Trading Strategy

Overview
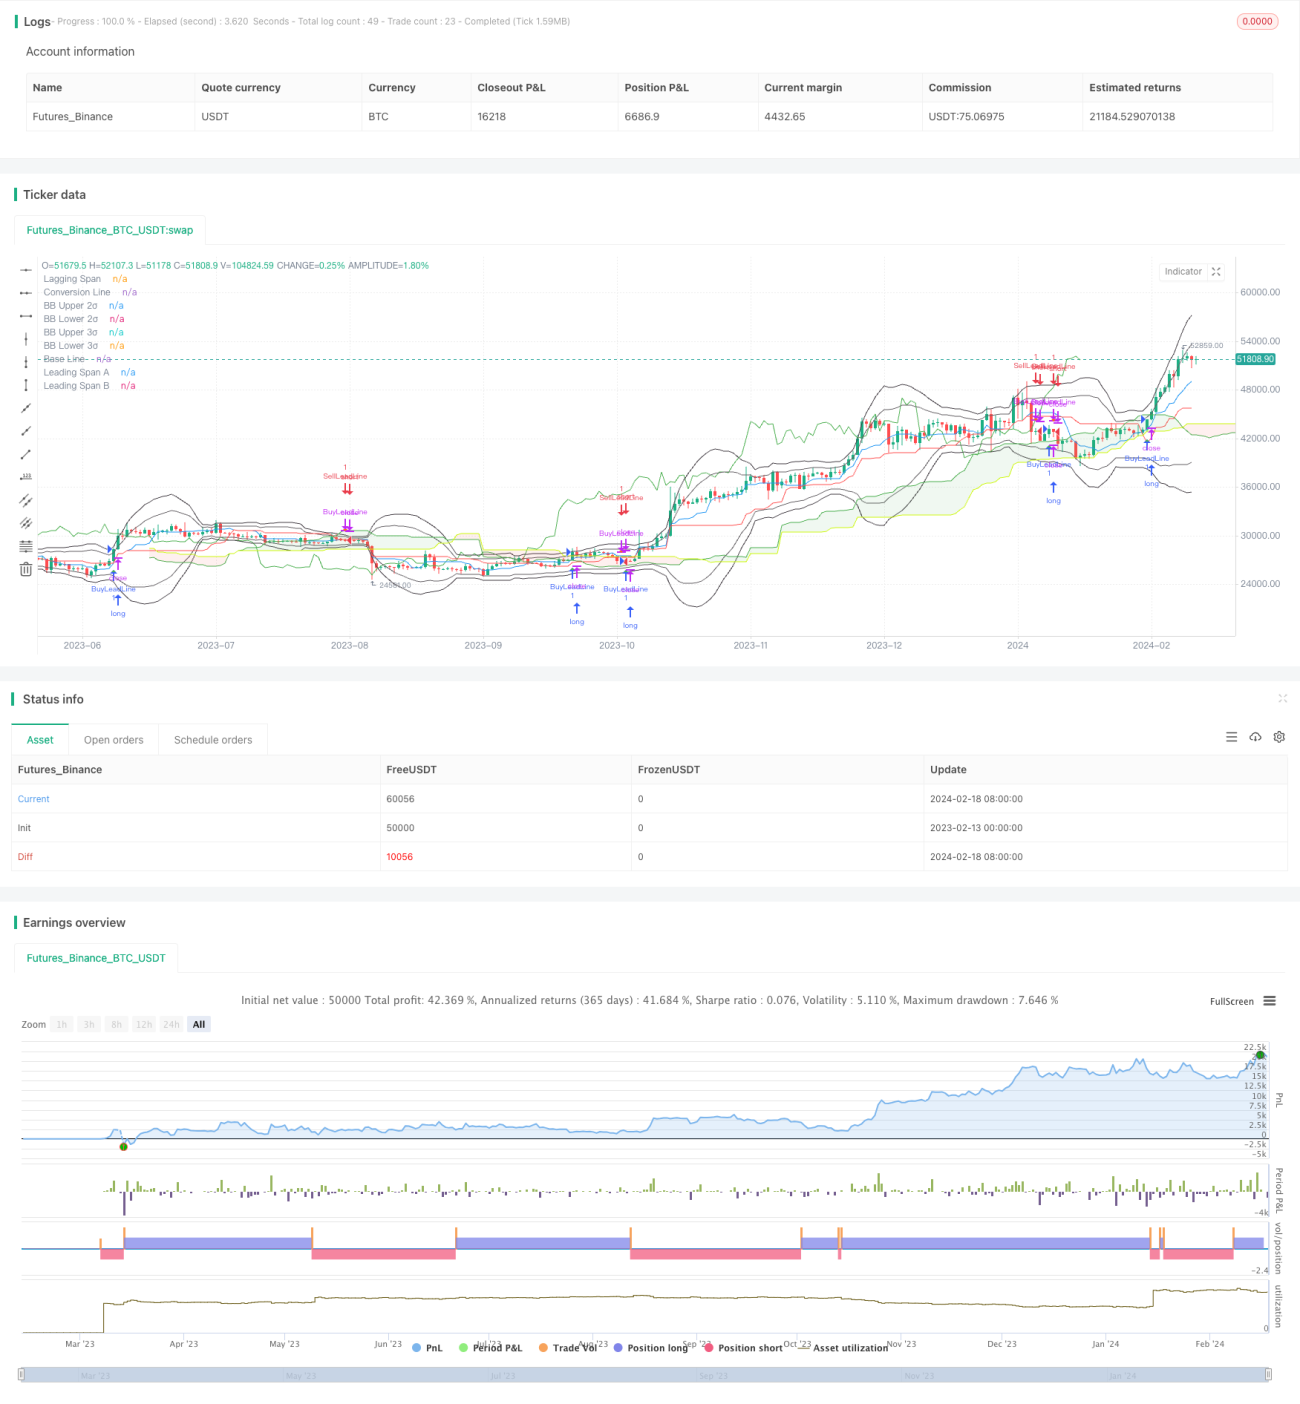
This is a quantitative trading strategy that combines the Ichimoku Cloud indicator and the Bollinger Bands indicator. The strategy utilizes the conversion line, base line, leading span A, and leading span B of the Ichimoku Cloud to generate trading signals, while using the Bollinger Bands to judge the volatility of the market and decide appropriate entry timings.
Strategy Logic
Ichimoku Cloud Indicator
The Ichimoku Cloud indicator consists of four lines: conversion line, base line, leading span A, and leading span B. The conversion line is the average closing price over a short-term period (9 days). The base line is the average closing price over a longer 26-day period. The leading span A is the average between the conversion line and base line, which leads the price action. The leading span B is the average closing price over an even longer 52-day period, which lags behind the price. Buy and sell signals are generated when the shorter-term moving average crosses over or under the longer-term one.
Bollinger Bands
The Bollinger Bands include three lines: middle line, upper band, and lower band. The middle line is a simple moving average of closing prices over an n-day period (set to 20 days here). The upper band is the middle line plus k times (set to 2 times here) the standard deviation. The lower band is the middle line minus k times the standard deviation. It judges whether prices are within normal fluctuation ranges and determines the volatility level of the market.
This strategy uses the gold cross and death cross of the leading span B to construct trading signals. It also incorporates the Bollinger Bands to determine price volatility and decides to enter the market when volatility is low.
Advantage Analysis
This strategy combines the Ichimoku Cloud indicator and Bollinger Bands to comprehensively determine market trends and volatility, which can effectively capture market change information to locate trading signals. The Ichimoku Cloud can determine the main trend direction of the market, while the Bollinger Bands can pinpoint specific entry timings.
The parameters of this strategy are adjustable to optimize for different products and market environments, making it highly adaptable. Using different parameter combinations of the Ichimoku Cloud can identify trading opportunities across cycles.
Risk Analysis
This strategy mainly relies on the Bollinger Bands to determine market volatility. The bands may fail when extreme volatility is caused by black swan events. In that case, the trading signals constructed based on the Ichimoku Cloud may generate false signals.
In addition, the Ichimoku Cloud lines themselves are also sensitive to sharp market fluctuations. The conversion and base lines could provide incorrect signals when prices swing wildly. Exiting positions or suspending trading is probably the best choice in such situations.
Optimization Directions
Other indicators can be considered in combination to determine entry timing, such as KDJ to see if the market is overbought/oversold, and MACD to check long-term/short-term moving average relationships. This can avoid entering the market during extreme volatility.
In addition, machine learning can be leveraged to optimize the parameters of the Ichimoku Cloud. Different parameters have significant impacts across cycles and products. Finding the optimal parameter combinations can greatly improve the strategy's profitability.
Conclusion
This strategy combines the Ichimoku Cloud indicator and Bollinger Bands to consider both market trends and volatility. It is an adaptive quantitative trading strategy. The strategy can be improved by adjusting parameters and optimizing entry rules to achieve good profits in live trading.
- 1