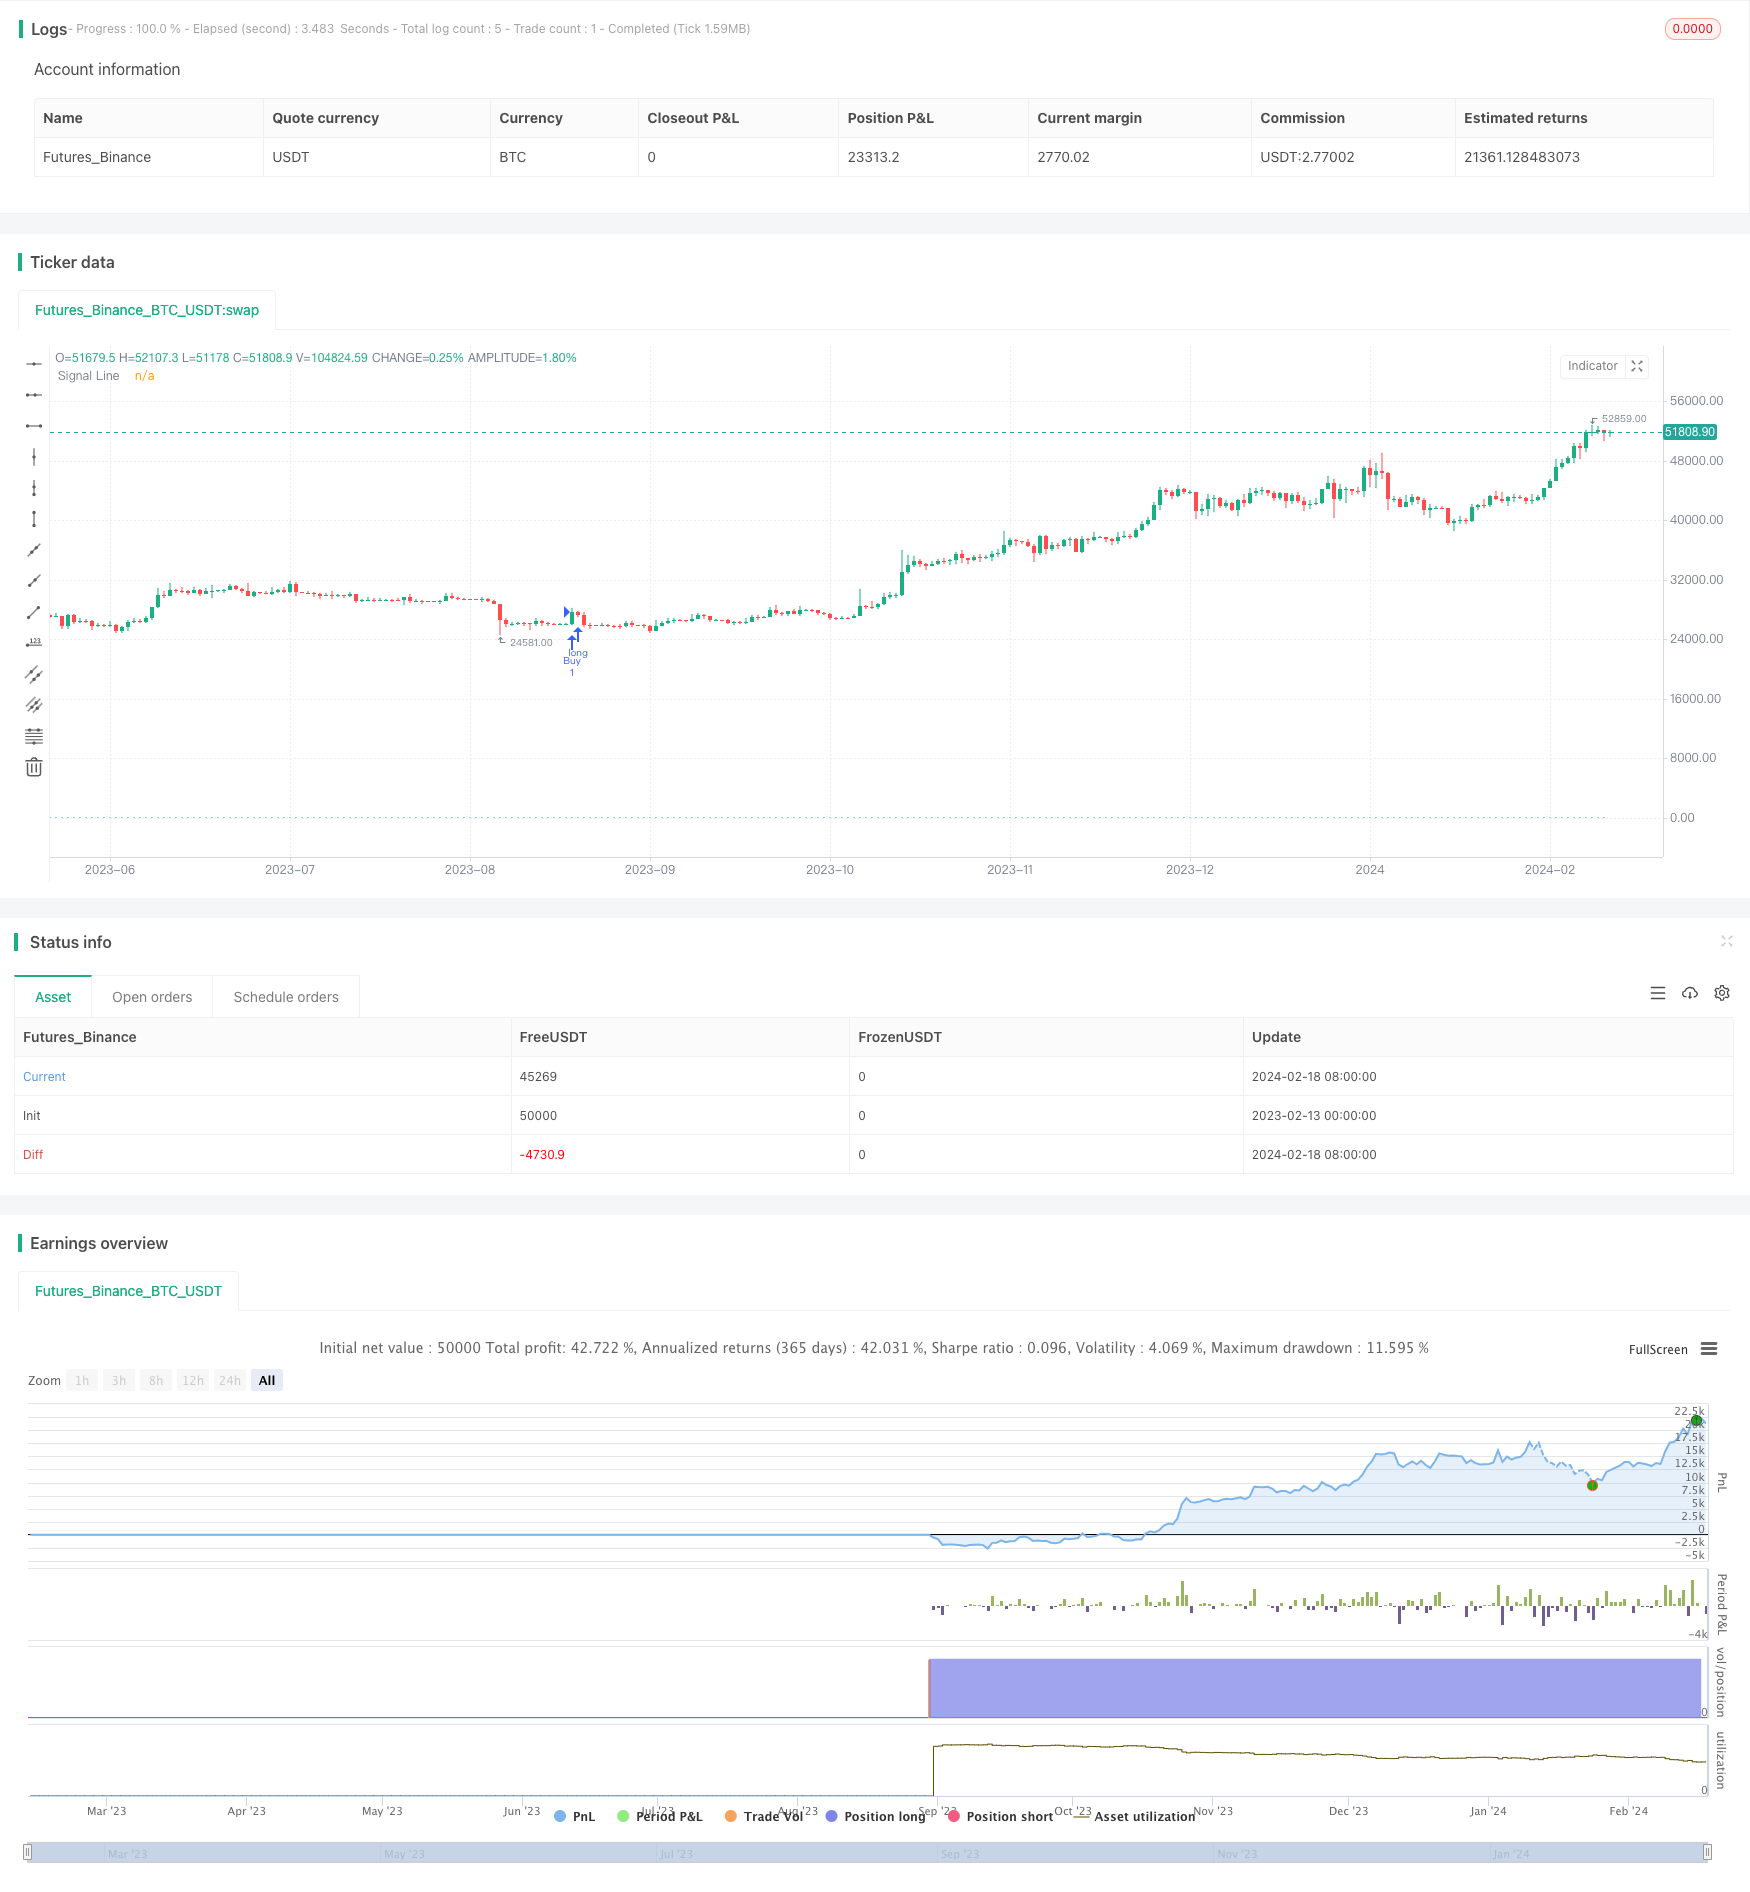
概述
多因子智能交易策略(Multi-factor Intelligent Trading Strategy)是一种集成多种技术指标的强大算法交易策略。它综合运用 Relative Strength Index(相对强弱指标)、Bollinger Bands(布林带)、Volume Profile(成交量分布)、Fibonacci Retracement(斐波那契回撤)、Average Directional Index(平均方向指数)和 Volume Weighted Average Price(成交量加权平均价)等多种指标,设定买入和卖出条件,以识别金融市场的潜在交易机会。
策略原理
该策略的主要原理基于多种技术指标的综合考量。首先,它使用 RSI 指标判断价格运动的势头和力度,寻找超买超卖的机会。其次,它运用布林带识别价格波动率并发现可能的趋势变化。此外,它通过观察成交量分布中的关键支撑阻力位来确定更可靠的进出场点。另外,它还会参考斐波那契回撤、平均方向指数和成交量加权平均价等指标,过滤信号和确认趋势。
当多种指标满足策略自定义的买入条件时,比如 RSI 下破30(超卖)、并交叉向上突破布林中轨的20日简单移动平均线时,该策略会产生买入信号,建立多头仓位。当卖出条件满足时,比如 RSI 上破70(超买)、并交叉向下跌破中轨时,该策略会发出卖出信号,平掉多头仓位。这种基于多因子的设计方法可以提高信号的可靠性,减少假信号,把握市场关键的转折点。
策略优势
多因子智能交易策略具有以下优势:
多因子设计可以提高交易信号质量,减少噪音,把握关键突破点。
运用多种指标确认趋势和滤除错误信号。
综合考量市场力量、波动、价量关系等多个维度。
结合反转和趋势策略的优点,把握潜在机会。
允许自定义买入卖出条件,可调整适应不同品种和市场环境。
提供清晰可视化的信号线,易于实盘操作。
策略风险
该策略也存在一些潜在风险需要注意:
参数优化不当可能导致过度交易或漏掉信号。需要反复测试和优化参数以保证稳定性。
多因子结合不当也会产生错误信号或增加市场noise。需要评估各因子之间关系。
无法完全避免巨大行情的方向风险。需要严格遵守资金管理原则,控制仓位规模。
买卖点离场效果可能会受到滑点成本的影响。可以设置适当的止损止盈来锁定利润。
策略优化
该策略可以从以下几个维度进行优化:
测试更多市场数据,优化指标参数组合以产生更稳定信号。
增加机器学习模型辅助做多因子决策。
结合情绪指标等更多外部因子过滤噪音交易。
设定动态止损止盈以更好适应市场变化。
研究指数或期货等更多品种的效果。
总结
多因子智能交易策略是一个非常有效的量化交易方法论。它整合多个因子产生高质量信号,在抓住市场机会的同时控制风险。通过不断测试与优化,该策略具有很大的应用前景。它代表了量化交易策略设计的发展方向,即运用先进模型与多个信号源深度融合,实现更智能化的决策。
/*backtest
start: 2023-02-13 00:00:00
end: 2024-02-19 00:00:00
period: 1d
basePeriod: 1h
exchanges: [{"eid":"Futures_Binance","currency":"BTC_USDT"}]
*/

// This source code is subject to the terms of the Mozilla Public License 2.0 at https://mozilla.org/MPL/2.0/
// © PRIDELEGENX005

//@version=5
//@version=5
strategy("ProfitCraft Strategy", shorttitle="CS", overlay=true)

// Input parameters
length = input(14, title="RSI Length")
overbought = input(70, title="Overbought")
oversold = input(30, title="Oversold")
bb_length = input(20, title="Bollinger Bands Length")
bb_mult = input(2, title="Bollinger Bands Std Dev")
vpvr_length = input(200, title="VPVR Length")
fibonacci_retracement = input(true, title="Fibonacci Retracement")
adx_length = input(14, title="ADX Length")
vwap_length = input(20, title="VWAP Length")

// Calculate RSI
rsi = ta.rsi(close, length)

// Calculate Bollinger Bands
sma = ta.sma(close, bb_length)
stddev = ta.stdev(close, bb_length)
upper_band = sma + bb_mult * stddev
lower_band = sma - bb_mult * stddev

// Calculate VPVR
vpvr_data = ta.sma(volume * (high - low), vpvr_length)

// Calculate Fibonacci Retracement
var high_fib = ta.highest(high, 30)
var low_fib = ta.lowest(low, 30)

// Calculate ADX (Manual calculation)
trueRange = ta.highest(high, 1) - ta.lowest(low, 1)
DMplus = ta.highest(high, 1) - high[1]
DMminus = low[1] - ta.lowest(low, 1)
TRn = ta.sma(trueRange, adx_length)
DMplusn = ta.sma(DMplus, adx_length)
DMminusn = ta.sma(DMminus, adx_length)
DIplus = 100 * (DMplusn / TRn)
DIminus = 100 * (DMminusn / TRn)
DX = 100 * math.abs(DIplus - DIminus) / (DIplus + DIminus)
ADX = ta.sma(DX, adx_length)

// Calculate VWAP
vwap = ta.sma(volume * close, vwap_length) / ta.sma(volume, vwap_length)

// Custom condition for buy/sell signals (example condition)
buy_condition = ta.crossover(rsi, oversold) and ta.crossover(close, sma)
sell_condition = ta.crossunder(rsi, overbought) and ta.crossunder(close, sma)

// Strategy entry and exit conditions
strategy.entry("Buy", strategy.long, when = buy_condition)
strategy.close("Buy", when = sell_condition)

// Plot the signal line
plot(buy_condition ? 1 : sell_condition ? -1 : 0, title="Signal Line", color=color.blue, style=plot.style_histogram)