Three Color Cross Trend Tracking Strategy

Author: ChaoZhang, Date: 2024-02-20 14:19:26
Tags:

img

Overview

The Three Color Cross Trend Tracking Strategy is a trend following trading strategy based on candlestick patterns. It identifies the direction of the current trend by recognizing specific three color candlestick patterns and selectively goes long or short when the patterns are identified.

Strategy Principle

The core logic of this strategy is: When three consecutive candlesticks of the same color (three red or three green) appear, followed by one candlestick of the opposite color, and then reverse back to the original three candlesticks’ color, it indicates the original trend is continuing. Therefore, this is the time to track the trend by entering into a position.

Specifically, the strategy detects the situation of the most recent five candlesticks to determine if the entry criteria are met. If the most recent five candlesticks are: the fifth candle has a lower low than the previous one (higher high for long), the fourth candle is a bullish candle (bearish for long), the third candle is a bearish candle (bullish for long), the second candle is a bearish candle (bullish for long), and the first candle is a bearish candle (bullish for long), then a short tracking position is opened. On the contrary, if the most recent five candlesticks are: the fifth candle has a higher high than the previous one, the fourth candle is a bearish one, the third candle is a bullish one, the second candle is a bullish one, and the first candle is a bullish one, then a long tracking position is opened. By judging the trend direction through such specific candlestick patterns, additional profits can be made when the trend persists.

Advantages of the Strategy

  • Determine trend direction easily using candlestick patterns
  • Make profits during trend persistence stages
  • Simple and clear strategy rules

Risks of the Strategy

  • Incorrect judgements of candlestick patterns may lead to losses
  • Unable to determine trend reversal points, may suffer losses following the trend
  • May frequently open positions, increasing trading costs

Directions for Strategy Optimization

  • Incorporate other indicators to judge reliability of candlestick patterns
  • Set stop loss points to control single trade loss
  • Optimize entry criteria to reduce probability of incorrect judgements
  • Consider adjusting position sizing to lower risks

Summary

The Three Color Cross Trend Tracking Strategy identifies current trend direction by recognizing specific candlestick patterns, and selectively opens positions when the trend persists. This strategy is simple, clear, easy to operate, and capable of gaining additional profits during trend stages. But it also carries some risks, and needs further optimization to improve stability. Overall, it serves as an effective complementary component in quantitative trading strategy portfolios.


/*backtest
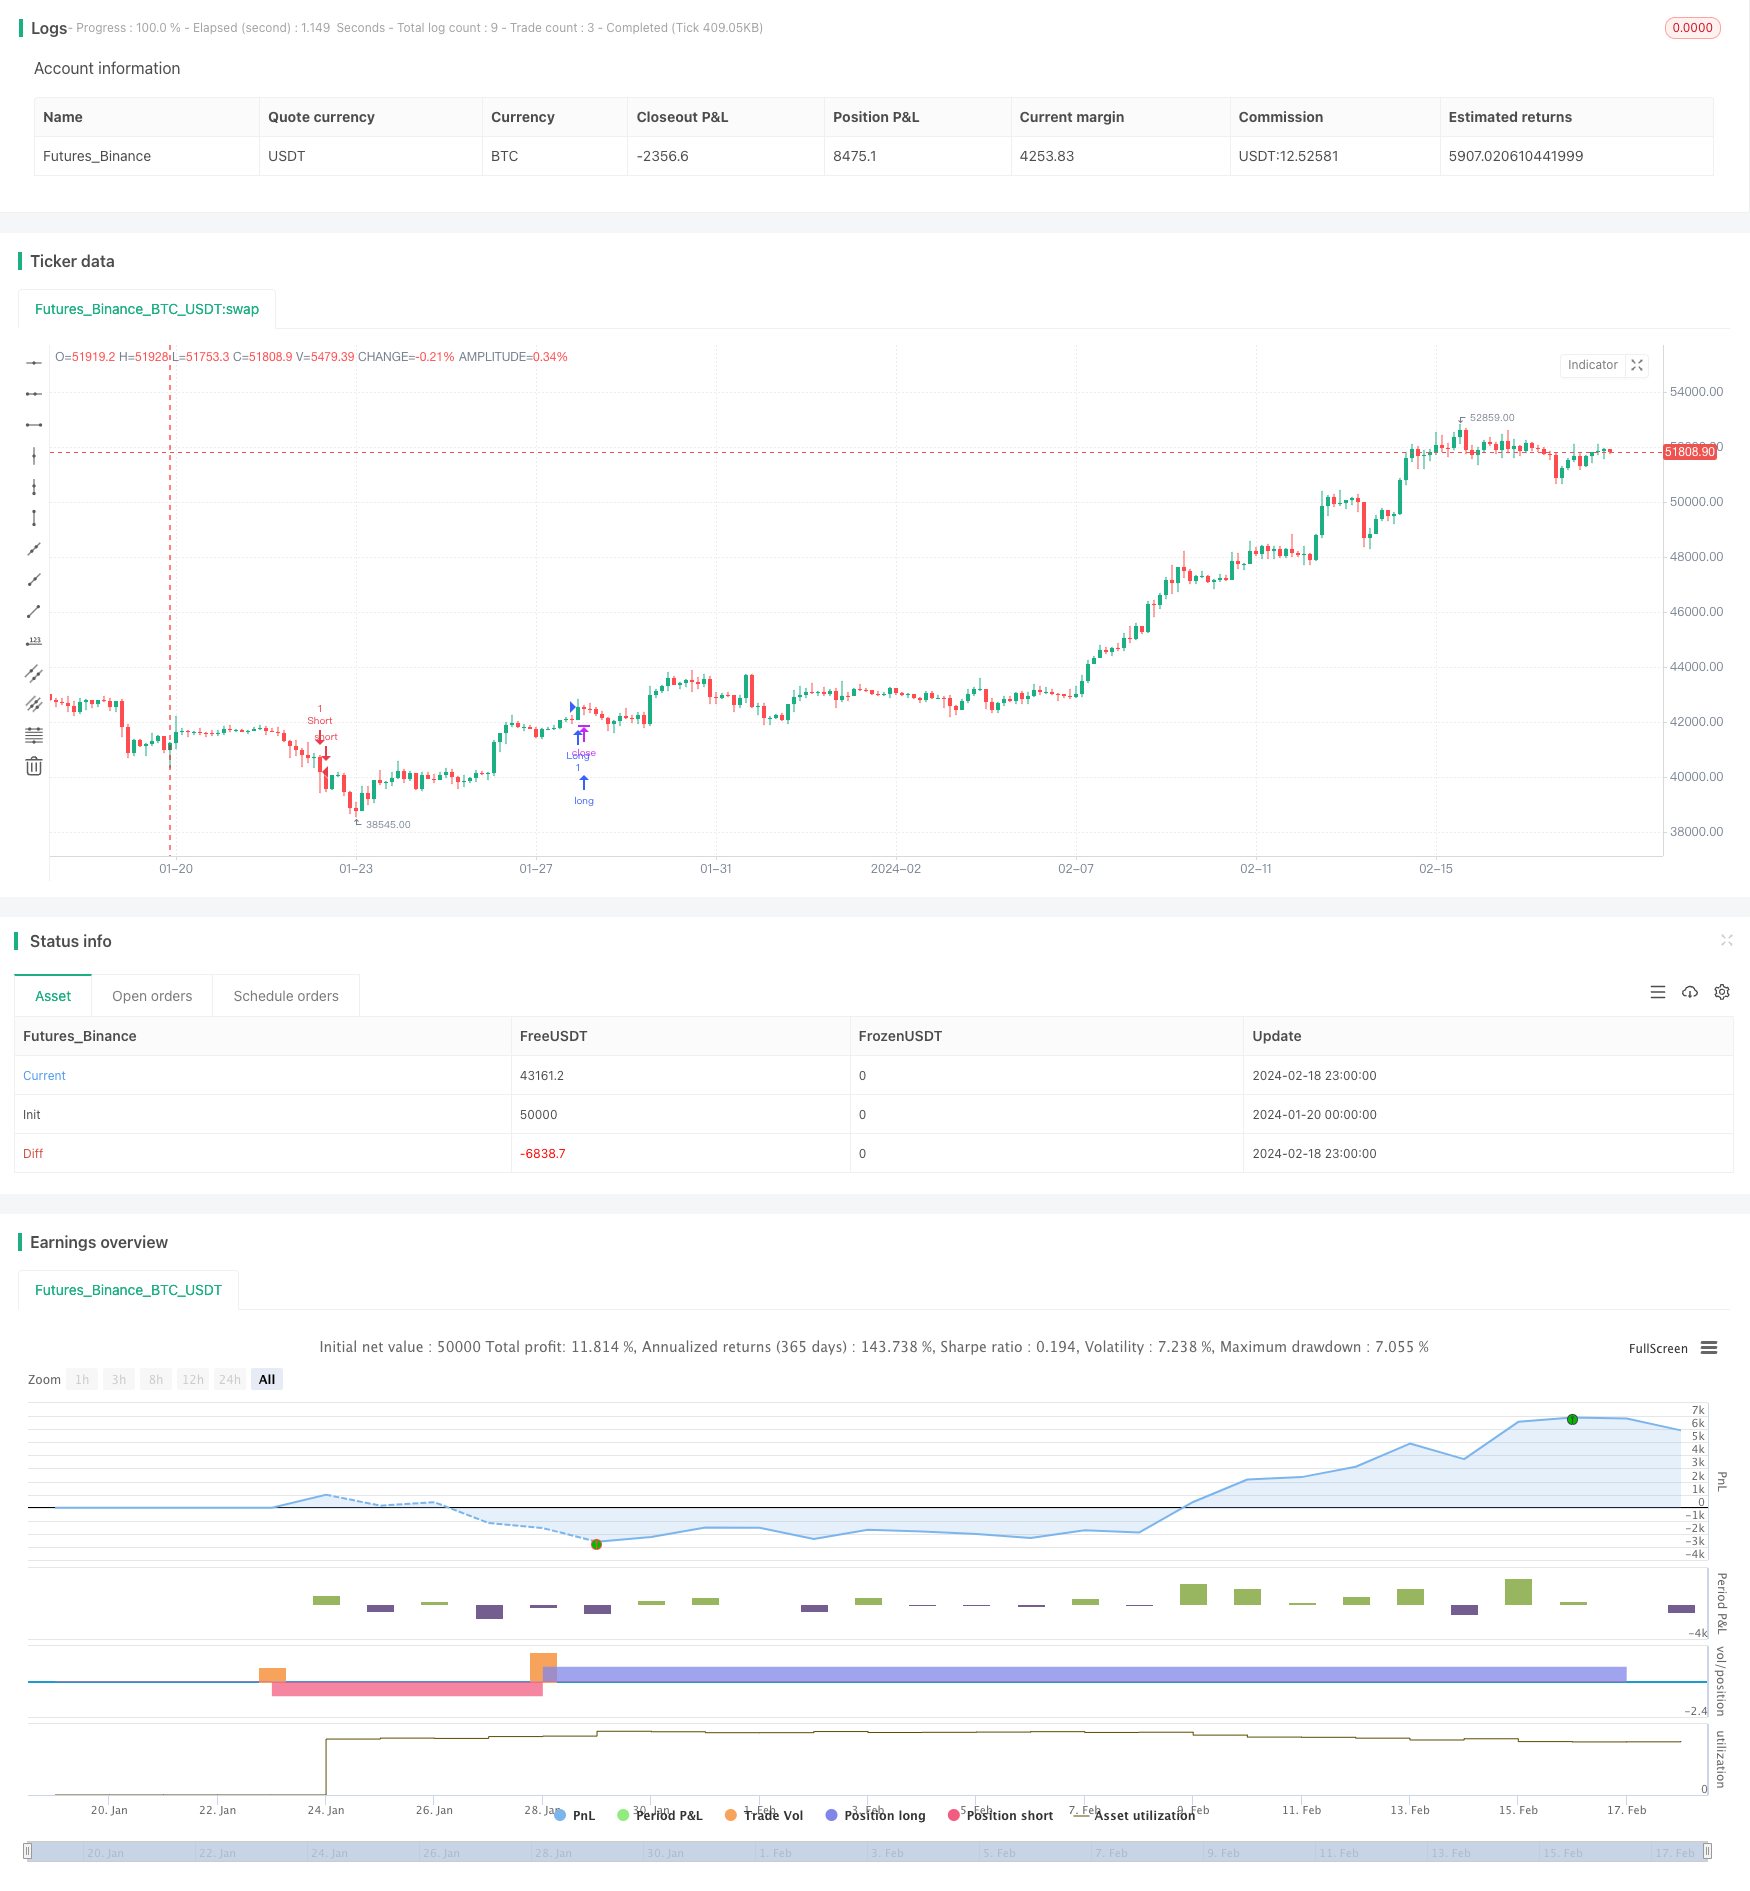
start: 2024-01-20 00:00:00
end: 2024-02-19 00:00:00
period: 3h
basePeriod: 15m
exchanges: [{"eid":"Futures_Binance","currency":"BTC_USDT"}]
*/

// This source code is subject to the terms of the Mozilla Public License 2.0 at https://mozilla.org/MPL/2.0/
// © softinterface2000

//@version=5
strategy("3 Line Strick", overlay=true, margin_long=100, margin_short=100)


//Sell
fifth= close < low[1]
fourth= close[1] > open[1]
third= close[2] < open[2]
seccond= close[3] < open[3]
first= close[4] < open[4]


//Buy
fifth1= close > high[1]
fourth1= close[1] < open[1]
third1= close[2] > open[2]
second1= close[3] > open[3]
first1= close[4] > open[4]


longCondition = fifth1 and fourth1 and third1 and second1 and first1
if (longCondition)
    strategy.entry("Long", strategy.long)

shortCondition = fifth and fourth and third and seccond and first
if (shortCondition)
    strategy.entry("Short", strategy.short)


More