概述
本策略的核心思想是利用枢轴点进行量化交易。它寻找重要的枢轴高点和低点,当价格突破这些关键点时,进行逆转交易。
策略原理
该策略首先定义了寻找枢轴高点和低点的函数pivotHighSig()和pivotLowSig()。这两个函数会在左侧和右侧寻找符合条件的枢轴点。
具体来说,对于枢轴高点,它会在左侧寻找连续多个更高的高点,在右侧寻找连续多个更低的高点。这样枢轴高点就处在一个相对更高的位置。枢轴低点的判断条件相反,它会在左右两侧寻找更高和更低的低点。
找到枢轴高低点后,策略会进一步挑选出枢轴的枢轴点,也就是枢轴点中的重要点。这通过定义枢轴高低点的多个历史变量如ph1,ph2等实现。
最后,当价格突破枢轴的枢轴点时,进行逆转交易。
策略优势
这种基于枢轴点的量化策略有以下几个优势:
- 利用了市场的支撑阻力区域,这些区域往往是价格反转的机会点
- 同时找重要的高点和低点,实现了多空双边交易
- 枢轴点是比较突出的 extremum 点,突破这样的点信号较强
- 利用枢轴的枢轴点,使信号更加可靠
风险及解决方法
该策略也存在一些风险:
- 误判枢轴点,导致错误信号。解决方法是调整左右区间参数,确保枢轴点识别更加准确。
- 突破假突破。解决方法是结合更多因素过滤信号,如量能,成交量等。
优化方向
这种策略还可以从以下几个方向进行优化:
- 增加止损策略,使策略更加稳定
- 结合更多指标进行信号过滤
- 开发反转PRED策略,利用ml进一步优化枢轴点预测
- 增加参数自适应功能
总结
本策略overall表现良好,核心思路是发现重要的枢轴点并在其突破时进行反转交易。通过进一步优化,这种策略可以获得更加稳定可靠的信号,从而获得良好的收益。
策略源码
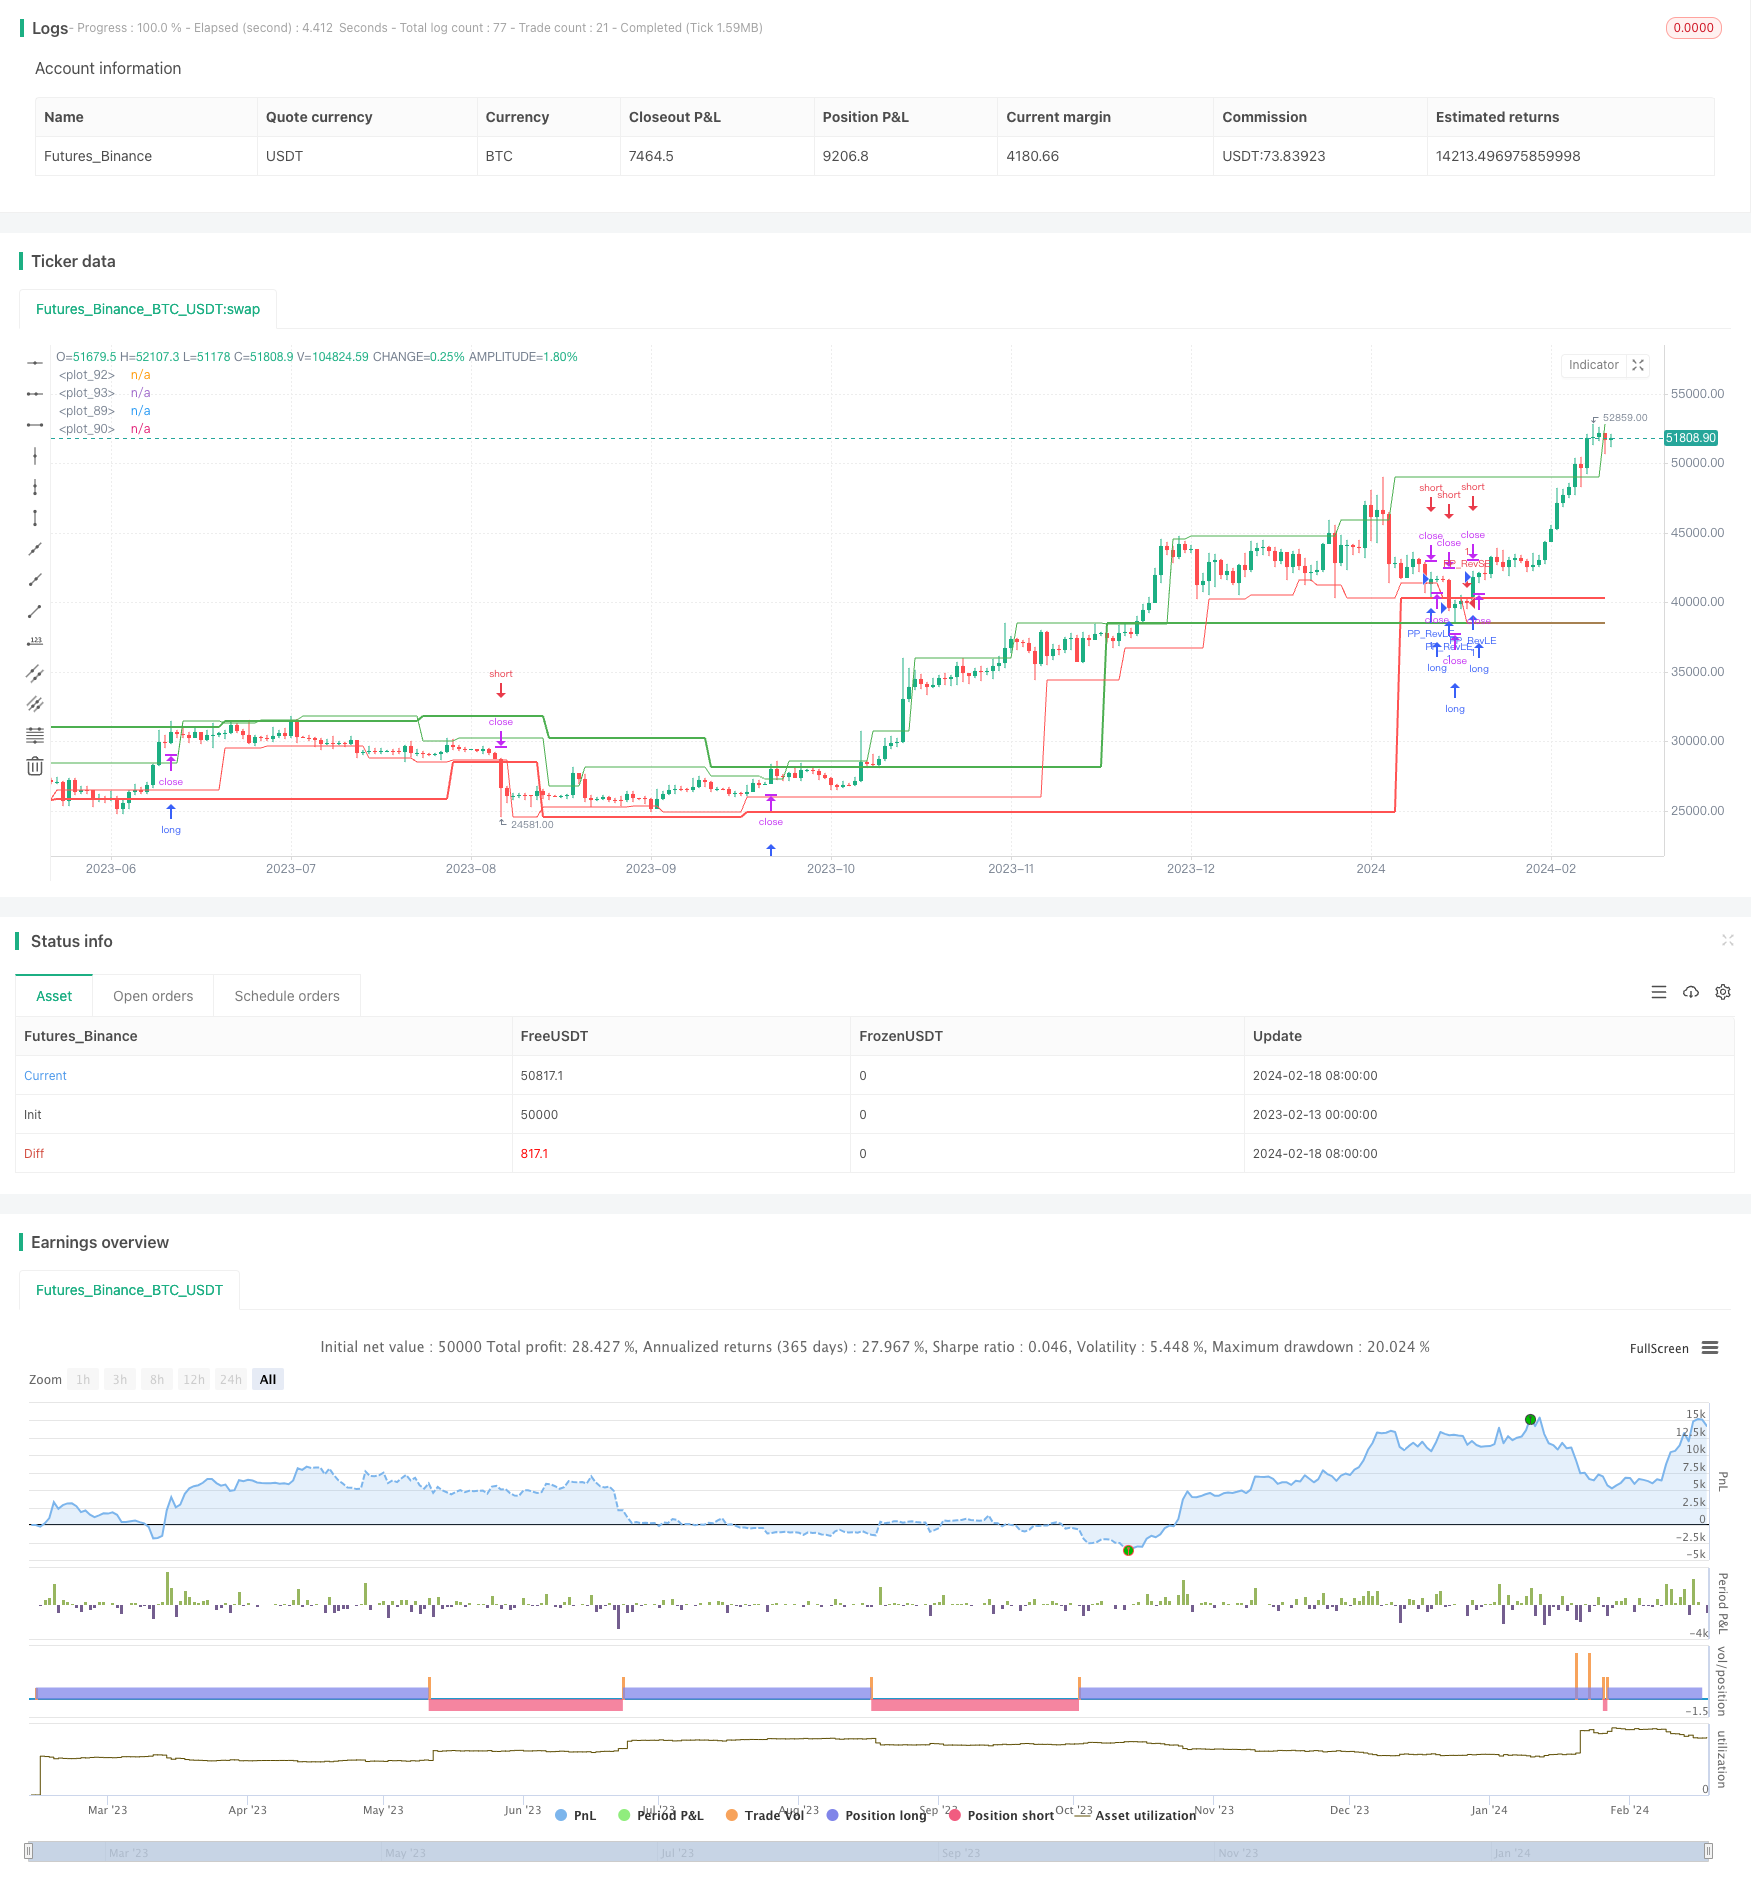
/*backtest
start: 2023-02-13 00:00:00
end: 2024-02-19 00:00:00
period: 1d
basePeriod: 1h
exchanges: [{"eid":"Futures_Binance","currency":"BTC_USDT"}]
*/

//@version=4
strategy("Pivot of Pivot Reversal Strategy [QuantNomad]", shorttitle = "PoP Reversal Strategy [QN]", overlay=true)

// Inputs
leftBars   = input(4,   title = 'PP Left Bars')
rightBars  = input(2,   title = 'PP Right Bars')
atr_length = input(14,  title = 'ATR Length')
atr_mult   = input(0.1, title = 'ATR Mult')

// Pivot High Significant Function
pivotHighSig(left, right) =>
    pp_ok = true
    atr   = atr(atr_length)

    for i = 1 to left
        if (high[right] < high[right+i] + atr * atr_mult)
            pp_ok := false
    for i = 0 to right-1
        if (high[right] < high[i] + atr * atr_mult)
            pp_ok := false

    pp_ok ? high[right] : na

// Pivot Low Significant Function
pivotLowSig(left, right) =>
    pp_ok = true
    atr   = atr(atr_length)

    for i = 1 to left
        if (low[right] > low[right+i] - atr * atr_mult)
            pp_ok := false
    for i = 0 to right-1
        if (low[right] > low[i] - atr * atr_mult)
            pp_ok := false

    pp_ok ? low[right] : na


swh = pivotHighSig(leftBars, rightBars)
swl = pivotLowSig (leftBars, rightBars)

swh_cond = not na(swh)

hprice = 0.0
hprice := swh_cond ? swh : hprice[1]

le = false
le := swh_cond ? true : (le[1] and high > hprice ? false : le[1])

swl_cond = not na(swl)

lprice = 0.0
lprice := swl_cond ? swl : lprice[1]

se = false
se := swl_cond ? true : (se[1] and low < lprice ? false : se[1])

// Pivots of pivots
ph1 = 0.0
ph2 = 0.0
ph3 = 0.0

pl1 = 0.0
pl2 = 0.0
pl3 = 0.0

pphprice = 0.0
pplprice = 0.0

ph3 := swh_cond ? nz(ph2[1]) : nz(ph3[1])
ph2 := swh_cond ? nz(ph1[1]) : nz(ph2[1])
ph1 := swh_cond ? hprice     : nz(ph1[1])

pl3 := swl_cond ? nz(pl2[1]) : nz(pl3[1])
pl2 := swl_cond ? nz(pl1[1]) : nz(pl2[1])
pl1 := swl_cond ? lprice     : nz(pl1[1])

pphprice := swh_cond and ph2 > ph1 and ph2 > ph3 ? ph2 : nz(pphprice[1])
pplprice := swl_cond and pl2 < pl1 and pl2 < pl3 ? pl2 : nz(pplprice[1])


if (le)
    strategy.entry("PP_RevLE", strategy.long, comment="PP_RevLE", stop=pphprice + syminfo.mintick)

if (se)
    strategy.entry("PP_RevSE", strategy.short, comment="PP_RevSE", stop=pplprice - syminfo.mintick)

// Plotting
plot(lprice, color = color.red,   transp = 55)
plot(hprice, color = color.green, transp = 55)

plot(pplprice, color = color.red,   transp = 0, linewidth = 2)
plot(pphprice, color = color.green, transp = 0, linewidth = 2)