概述
该策略基于DMI指标构建,通过监测+DI和-DI的交叉来判断股价趋势方向,配合ADX指标来识别趋势强弱,从而实现趋势跟踪。当+DI上穿-DI时作多头入场,当止损价触发或-DI下穿+DI时平仓。
策略原理
该策略使用DMI指标的两个组成部分:+DI和-DI。+DI测量上升动量,+DI上穿-DI表明买盘的上升动量加强。-DI测量下降动量,-DI下穿+DI表明卖盘的下降动量加强。
当+DI上穿-DI时,表示上升趋势形成,这时策略作多头入场。入场后,线性移动止损跟踪最高价的一定比例。当价格出现回落,止损价格会随之下降,在一定程度上锁住了之前的盈利。
当-DI下穿+DI时,表示下降趋势取代,这时策略平仓。可通过ADX指标识别趋势的强弱,ADX越高,表明股价趋势越明显。因此,策略采用ADX作为辅助判断指标,只在ADX在某个区间内的时候才入场。
总的来说,该策略捕捉股价趋势转折点,实现移动平均趋势跟踪。
策略优势分析
该策略的优势主要体现在三个方面:
利用DMI指标判断股价趋势方向准确可靠。DMI比简单移动平均线等指标判断趋势转折更准确。
应用ADX指标识别趋势的强弱,避免在震荡行情中频繁交易。使策略更稳健。
线性移动止损机制,能够动态调整止损位置,在趋势反转时提前止损。并锁定部分利润,有效控制风险。
策略规则简单清晰,容易理解和实施,适合量化交易。
风险分析
该策略的主要风险有:
DMI指标在某些特殊市场中失效的可能性。DMI并不适用所有的市场,当趋势不明显时,容易产生错误信号。
股价出现跳空回落,超过止损点后再跌破的风险。留有一定缓冲余地可以降低这种风险。
ADX参数设置不当的风险。ADX参数直接影响策略择时的结果,如果设置过大或过小都会影响绩效。
因为使用了线性移动止损方法,在快速上涨中易被止损出场的风险。这时可以根据具体情况调整止损跟踪参数。
可以通过参数调优,严格止损,优化程序框架等方式进一步降低风险。
优化方向
该策略可以从以下几个方面进行优化:
利用MACD、KDJ等其他指标进行辅助判断,提高策略的稳定性。
测试不同的止损方式,如曲线移动止损、时间移动止损等方法。
增加仓位管理机制,在趋势方向确定后逐步加仓,提高盈利率。
结合高频因子、机器学习等方法动态优化DMI和ADX的参数,使策略更加智能化。
增加程序化风控模块,利用风险预算等方法严密控制最大回撤。
通过多种手段配合,能够有效提升策略的效率、稳定性与安全性。
总结
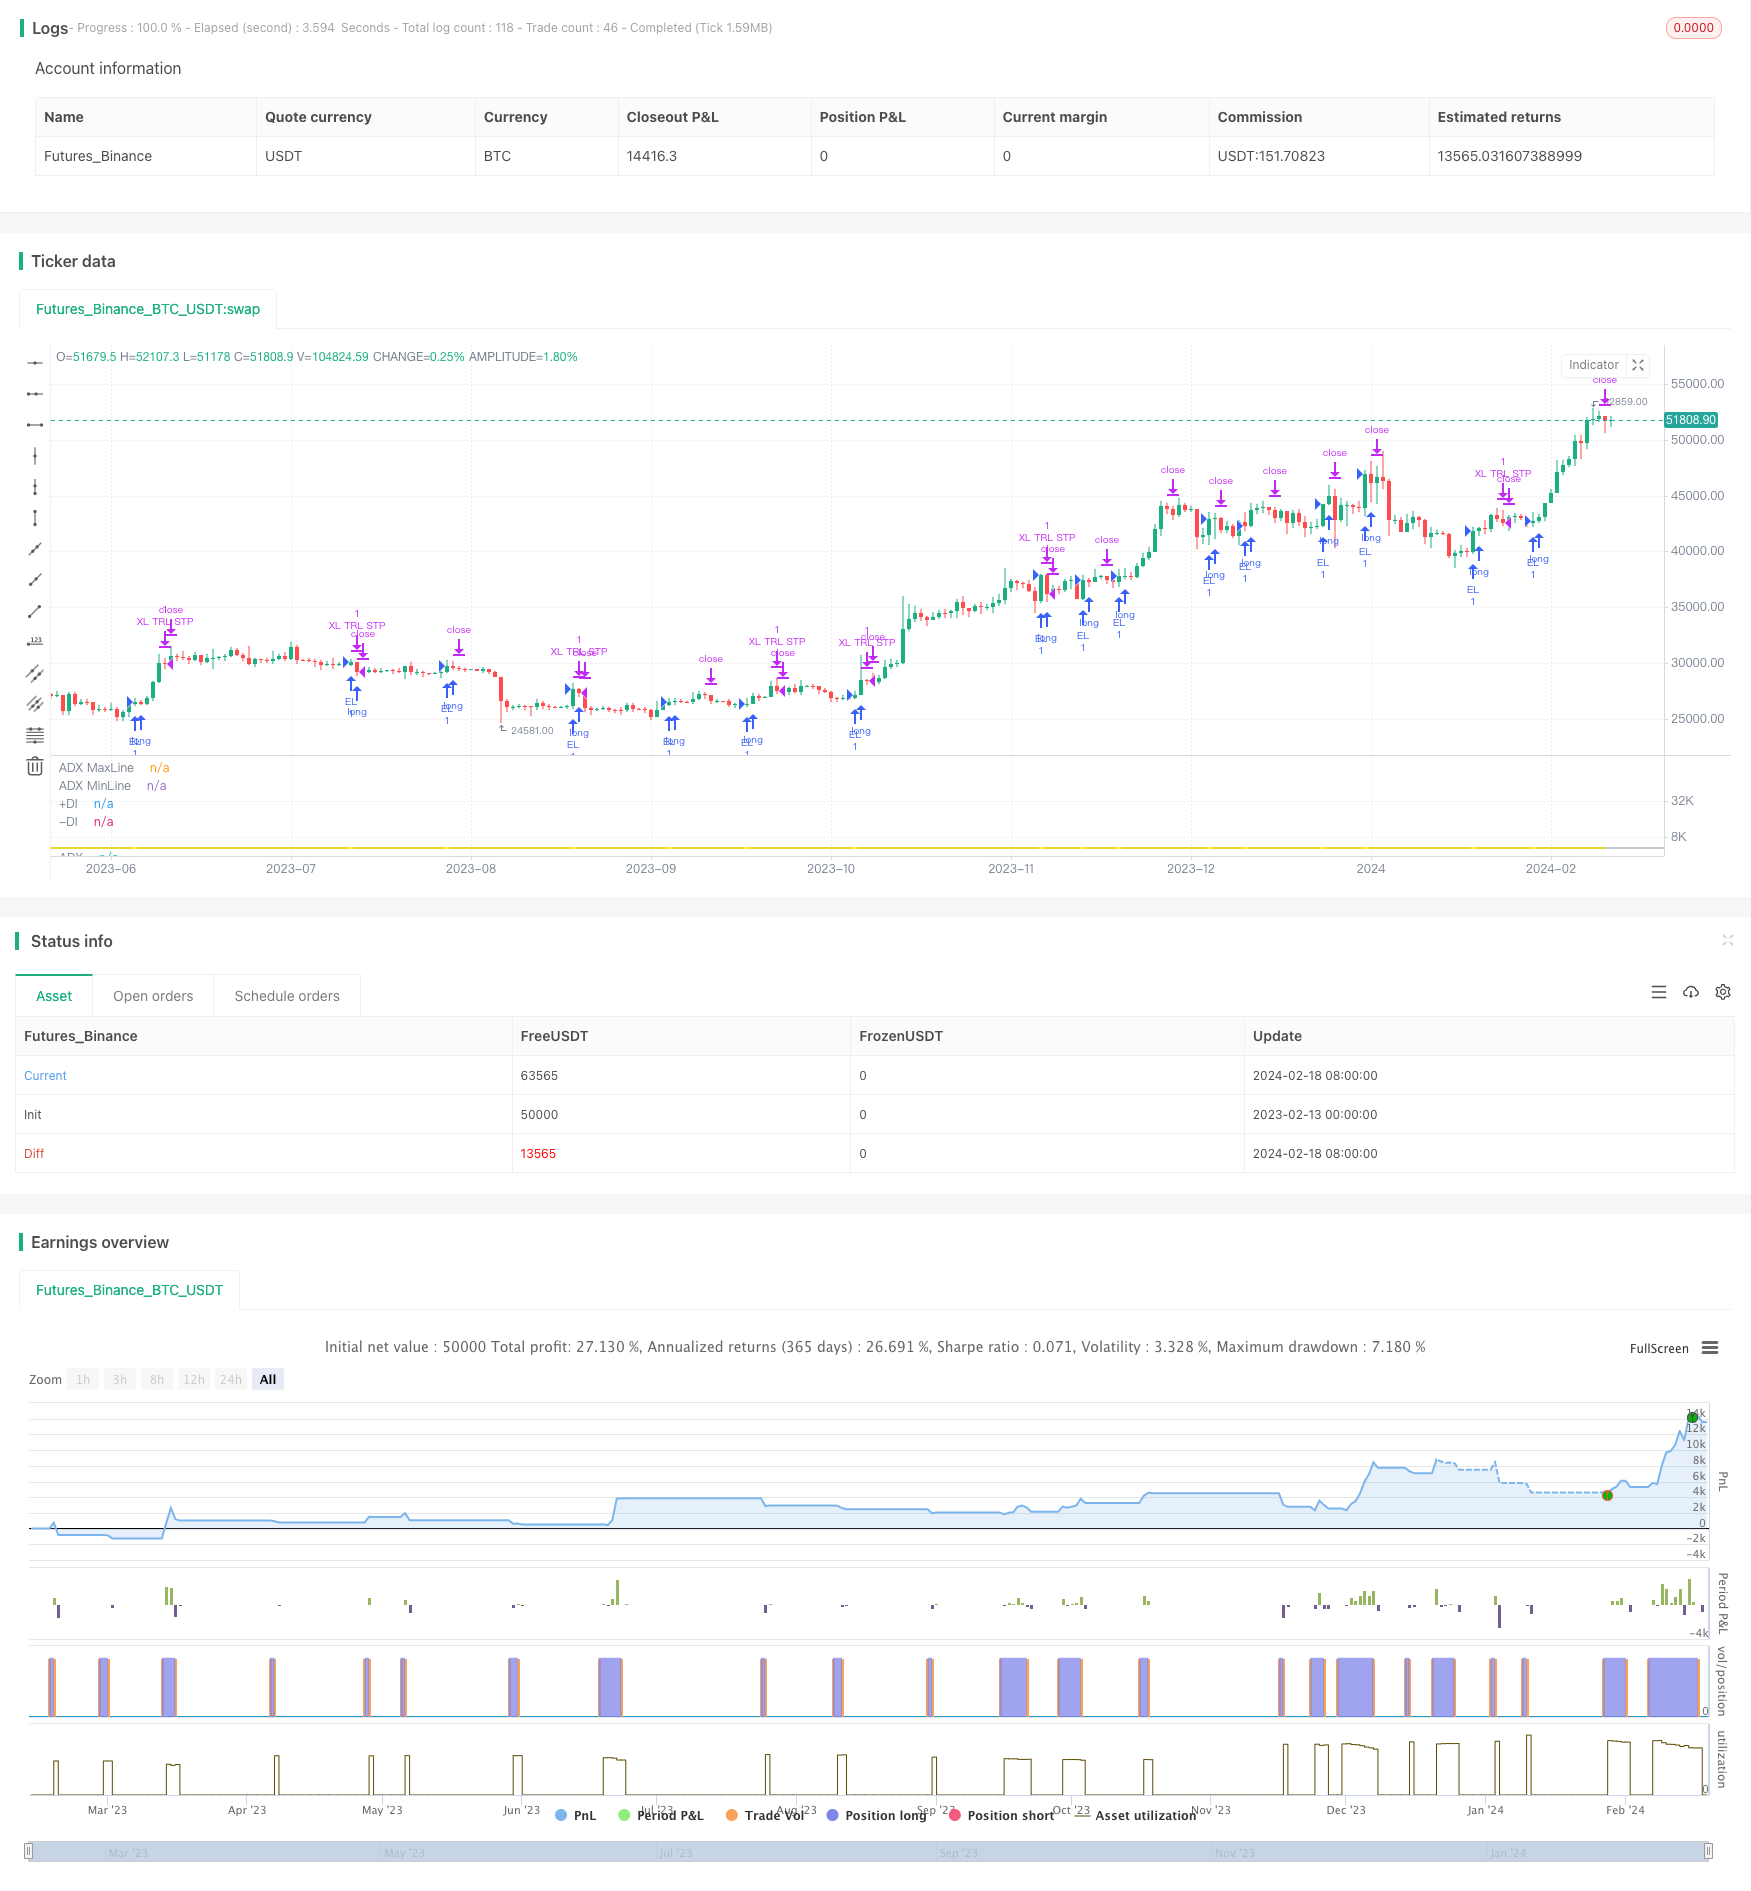
该策略整体运行逻辑清晰易懂,利用DMI指标判断股价趋势方向,ADX指标辅助判断趋势强度,线性移动止损方式有效控制风险。策略表现相对稳定,但仍需防范一定的风险。通过持续优化测试,逐步完善策略的稳健性与效率。相信该策略有望成为移动平均跟踪类策略的优秀代表。
/*backtest
start: 2023-02-13 00:00:00
end: 2024-02-19 00:00:00
period: 1d
basePeriod: 1h
exchanges: [{"eid":"Futures_Binance","currency":"BTC_USDT"}]
*/

// This source code is subject to the terms of the Mozilla Public License 2.0 at https://mozilla.org/MPL/2.0/
//@version=5
//1.0 - 240202 @caddjax

strategy(title = "+DI Crossover", overlay=false)

//DMI + ADX Chart w/ overlay
// © jrregencia

lensig = input.int(14, title="ADX Smoothing", minval=1, maxval=50)
len = input.int(6, minval=1, title="DI Length")
up = ta.change(high)
down = -ta.change(low)
plusDM = na(up) ? na : (up > down and up > 0 ? up : 0)
minusDM = na(down) ? na : (down > up and down > 0 ? down : 0)
trur = ta.rma(ta.tr, len)
plus = fixnan(100 * ta.rma(plusDM, len) / trur)
minus = fixnan(100 * ta.rma(minusDM, len) / trur)
sum = plus + minus
adx = 100 * ta.rma(math.abs(plus - minus) / (sum == 0 ? 1 : sum), lensig)
adxmax = input.int(50, title="ADX Max Buying Area", minval=1, maxval=100)
adxmin = input.int(0, title="ADX Min Buying Area", minval=0, maxval=99)


//DI cross alert
DIPcross = ta.crossover(plus, minus) ? plus : na
plotshape(DIPcross, style = shape.cross , color=color.white, location=location.absolute)

plot(adx, color=color.rgb(255, 238, 0, 23), title="ADX", linewidth=2)
p1 = plot(plus, color=color.rgb(16, 137, 0, 31), title="+DI", linewidth=1)
p2 = plot(minus, color=color.rgb(143, 82, 255, 25), title="-DI", linewidth=1)
adxmaxl = hline(adxmax, title="ADX MaxLine", color=color.silver, linestyle=hline.style_solid)
adxminl = hline(adxmin, title="ADX MinLine", color=color.silver, linestyle=hline.style_solid)
fill(p1, p2, title="Cloud Fill", color = plus > minus ? color.teal : color.red, transp=50)
fill(adxmaxl, adxminl, title="ADX Fill", color=color.silver, transp=90)

// Configure trail stop level with input options (optional)
longTrailPerc = input.float(3, title="Trail Long Loss (%)",
     minval=0.0, step=0.1) * 0.01
// Determine trail stop loss prices
longStopPrice = 0.0

// Determine entry condition
enterLong = ta.crossover(plus, minus) ? plus : na

longStopPrice := if strategy.position_size > 0
    stopValue = high[1] * (1 - longTrailPerc)
    math.max(stopValue, longStopPrice[1])
else
    0
// Submit entry orders
if enterLong
    strategy.entry("EL", strategy.long)
// Submit exit orders for trail stop loss price
if strategy.position_size > 0
    strategy.exit("XL TRL STP", stop=longStopPrice)