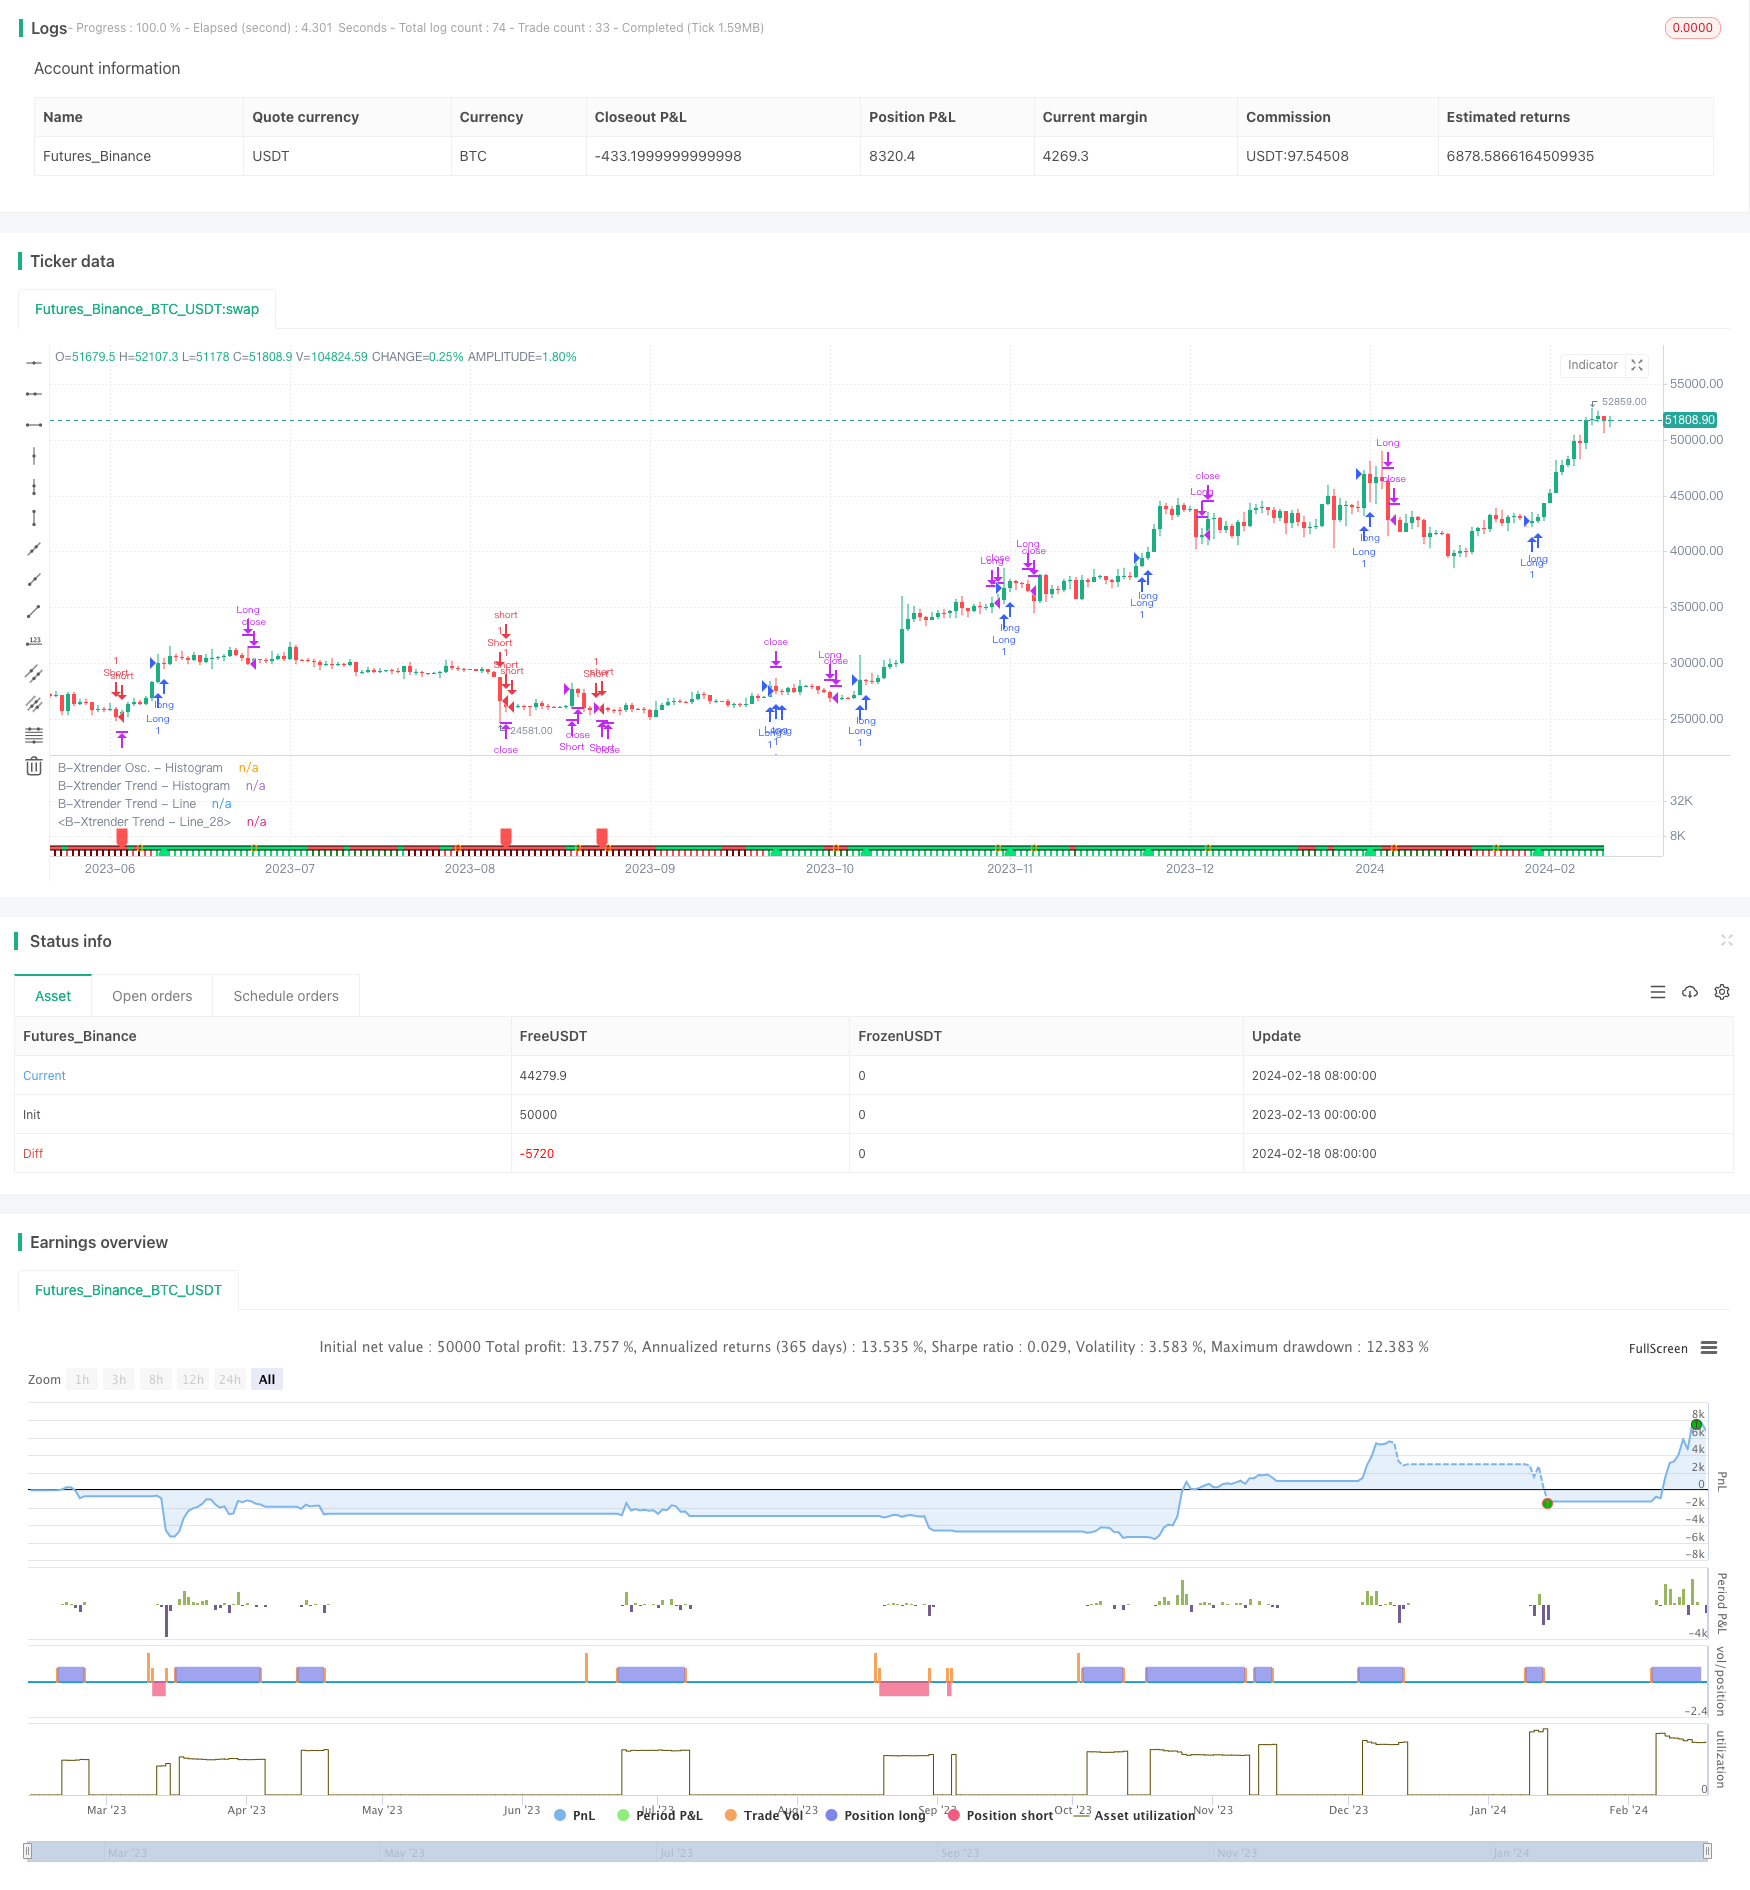
概述
该策略是一个基于指数均线交叉原理的交易策略。它同时结合了RSI指标和均线过滤器,形成了一套较为完整的趋势跟踪和反转交易体系。
策略原理
- 利用指数移动平均线的快慢交叉形成交易信号。快线参数为5和20日线的EMA交叉,慢线参数为20和15日线的EMA交叉。
- 快线上穿慢线时做多,快线下穿慢线时做空。采用RSI指标进行二次验证,只有当RSI也同向交叉时才证实交易信号的有效性。
- 加入200日移动平均线作为过滤器,只有价格突破该均线时才会发出交易信号,从而避免了震荡行情下的多次虚假交叉。
策略优势
- 双EMA交叉结合RSI指标,大幅提高信号的可靠性,降低了虚假信号率。
- 通过快慢EMA参数的搭配,既考虑了交易信号的灵敏度,也确保了信号的稳定性。
- 均线过滤器的加入,可有效过滤震荡行情下的噪音,避免不必要的交易。
策略风险
- EMA是一种滞后指标,在价格剧烈变动时会有明显的滞后。这会导致亏损加大或信号被漏掉的风险。
- RSI参数设置不当也会导致信号产生滞后。
- 均线过滤虽然可避免震荡市,但在趋势开始阶段也可能会过滤掉早期entry机会。
策略优化方向
- 动态调整EMA参数,在不同周期选择最优参数组合。
- 尝试其他指标如MACD等与RSI进行组合。
- 优化均线过滤器参数,在去噪与获取机会之间找到平衡。
总结
该策略总体来说是一个打造较为完备的指数移动平均线交易体系。它在获取交易信号的基础上,额外引入RSI指标进行多层验证。这无疑可大幅提高信号质量,是一个值得学习与优化的策略。当然由于本身指标滞后的特点,也应注意防范止损不及时等风险。
策略源码
/*backtest
start: 2023-02-13 00:00:00
end: 2024-02-19 00:00:00
period: 1d
basePeriod: 1h
exchanges: [{"eid":"Futures_Binance","currency":"BTC_USDT"}]
*/

// This source code is subject to the terms of the Mozilla Public License 2.0 at https://mozilla.org/MPL/2.0/
// © QuantTherapy
//@version=4
strategy("B-Xtrender [Backtest Edition] @QuantTherapy")

i_short_l1  = input(5 , title="[Short] L1")
i_short_l2  = input(20, title="[Short] L2")
i_short_l3  = input(15, title="[Short] L3")

i_long_l1   = input(20, title="[Long] L1")
i_long_l2   = input(15, title="[Long] L2")

i_ma_use    = input(true , title="[MA Filter] Yes/No" )
i_ma_len    = input(200  , title="[MA Filter] length" )
i_ma_type   = input("EMA", title="[MA Filter] type", options = ["SMA", "EMA"])

shortTermXtrender = rsi( ema(close, i_short_l1) - ema(close, i_short_l2), i_short_l3 ) - 50
longTermXtrender  = rsi( ema(close, i_long_l1), i_long_l2 ) - 50

shortXtrenderCol = shortTermXtrender > 0 ? shortTermXtrender > shortTermXtrender[1] ? color.lime : #228B22 : shortTermXtrender > shortTermXtrender[1] ? color.red : #8B0000
plot(shortTermXtrender, color=shortXtrenderCol, style=plot.style_columns, linewidth=1, title="B-Xtrender Osc. - Histogram", transp = 40)

longXtrenderCol   = longTermXtrender> 0 ? longTermXtrender > longTermXtrender[1] ? color.lime : #228B22 : longTermXtrender > longTermXtrender[1] ? color.red : #8B0000
macollongXtrenderCol =  longTermXtrender > longTermXtrender[1] ? color.lime : color.red
plot(longTermXtrender , color=longXtrenderCol, style=plot.style_columns, linewidth=2, title="B-Xtrender Trend - Histogram", transp = 90)

plot(longTermXtrender , color=#000000             , style=plot.style_line, linewidth=5, title="B-Xtrender Trend - Line", transp = 100)
plot(longTermXtrender , color=macollongXtrenderCol, style=plot.style_line, linewidth=3, title="B-Xtrender Trend - Line", transp = 100)

// --- Initialize MA Filter
ma = i_ma_type == "EMA" ? ema(close, i_ma_len) : sma(close, i_ma_len)
maFilterLong = true
maFilterShort = true
if i_ma_use
    maFilterLong  := close > ma ? true : false
    maFilterShort := close < ma ? true : false

long  = shortTermXtrender > 0 and longTermXtrender > 0 and maFilterLong
closeLong = shortTermXtrender < 0 or longTermXtrender < 0
short = shortTermXtrender < 0 and longTermXtrender < 0 and maFilterShort
closeShort = shortTermXtrender > 0 or longTermXtrender > 0

plotshape(long[1]==true  and long[2]==false  ? 0 : na , location=location.absolute, style=shape.labelup  , color=color.lime, size=size.small, transp=10)
plotshape(short[1]==true and short[2]==false ? 0 : na, location=location.absolute, style=shape.labeldown, color=color.red , size=size.small, transp=10)
plotshape(closeLong[1]==true and closeLong[2]==false
 or closeShort[1]==true and closeShort[2]==false ? 0 : na, location=location.absolute, style=shape.circle, color=color.orange , size=size.small)

i_perc     = input(defval = 20.0, title = "[TSL-%] Percent"  , minval = 0.1 )
i_src = close // constant for calculation
sl_val = i_src * i_perc / 100

strategy.entry("Long", strategy.long, when = long )
strategy.close("Long", when = closeLong)

strategy.entry("Short", strategy.short, when = short)
strategy.close("Short", when = closeShort)

// Calculate SL
longStopPrice = 0.0, shortStopPrice = 0.0
longStopPrice := if (strategy.position_size > 0)
    stopValue = close - sl_val
    max(stopValue, longStopPrice[1])
else
    0

shortStopPrice := if (strategy.position_size < 0)
    stopValue = close + sl_val
    min(stopValue, shortStopPrice[1])
else
    syminfo.mintick*1000000

// For TSL Visualisation on Chart
// plot(series=(strategy.position_size > 0) ? longStopPrice : na,
//      color=color.fuchsia, style = plot.style_circles,
//      linewidth=1, title="Long Trail Stop")

// plot(series=(strategy.position_size < 0) ? shortStopPrice : na,
//      color=color.fuchsia, style = plot.style_circles,
//      linewidth=1, title="Short Trail Stop")

if (strategy.position_size > 0)
    strategy.exit(id="TSL Long", stop=longStopPrice)

if (strategy.position_size < 0)
    strategy.exit(id="TSL Short", stop=shortStopPrice)