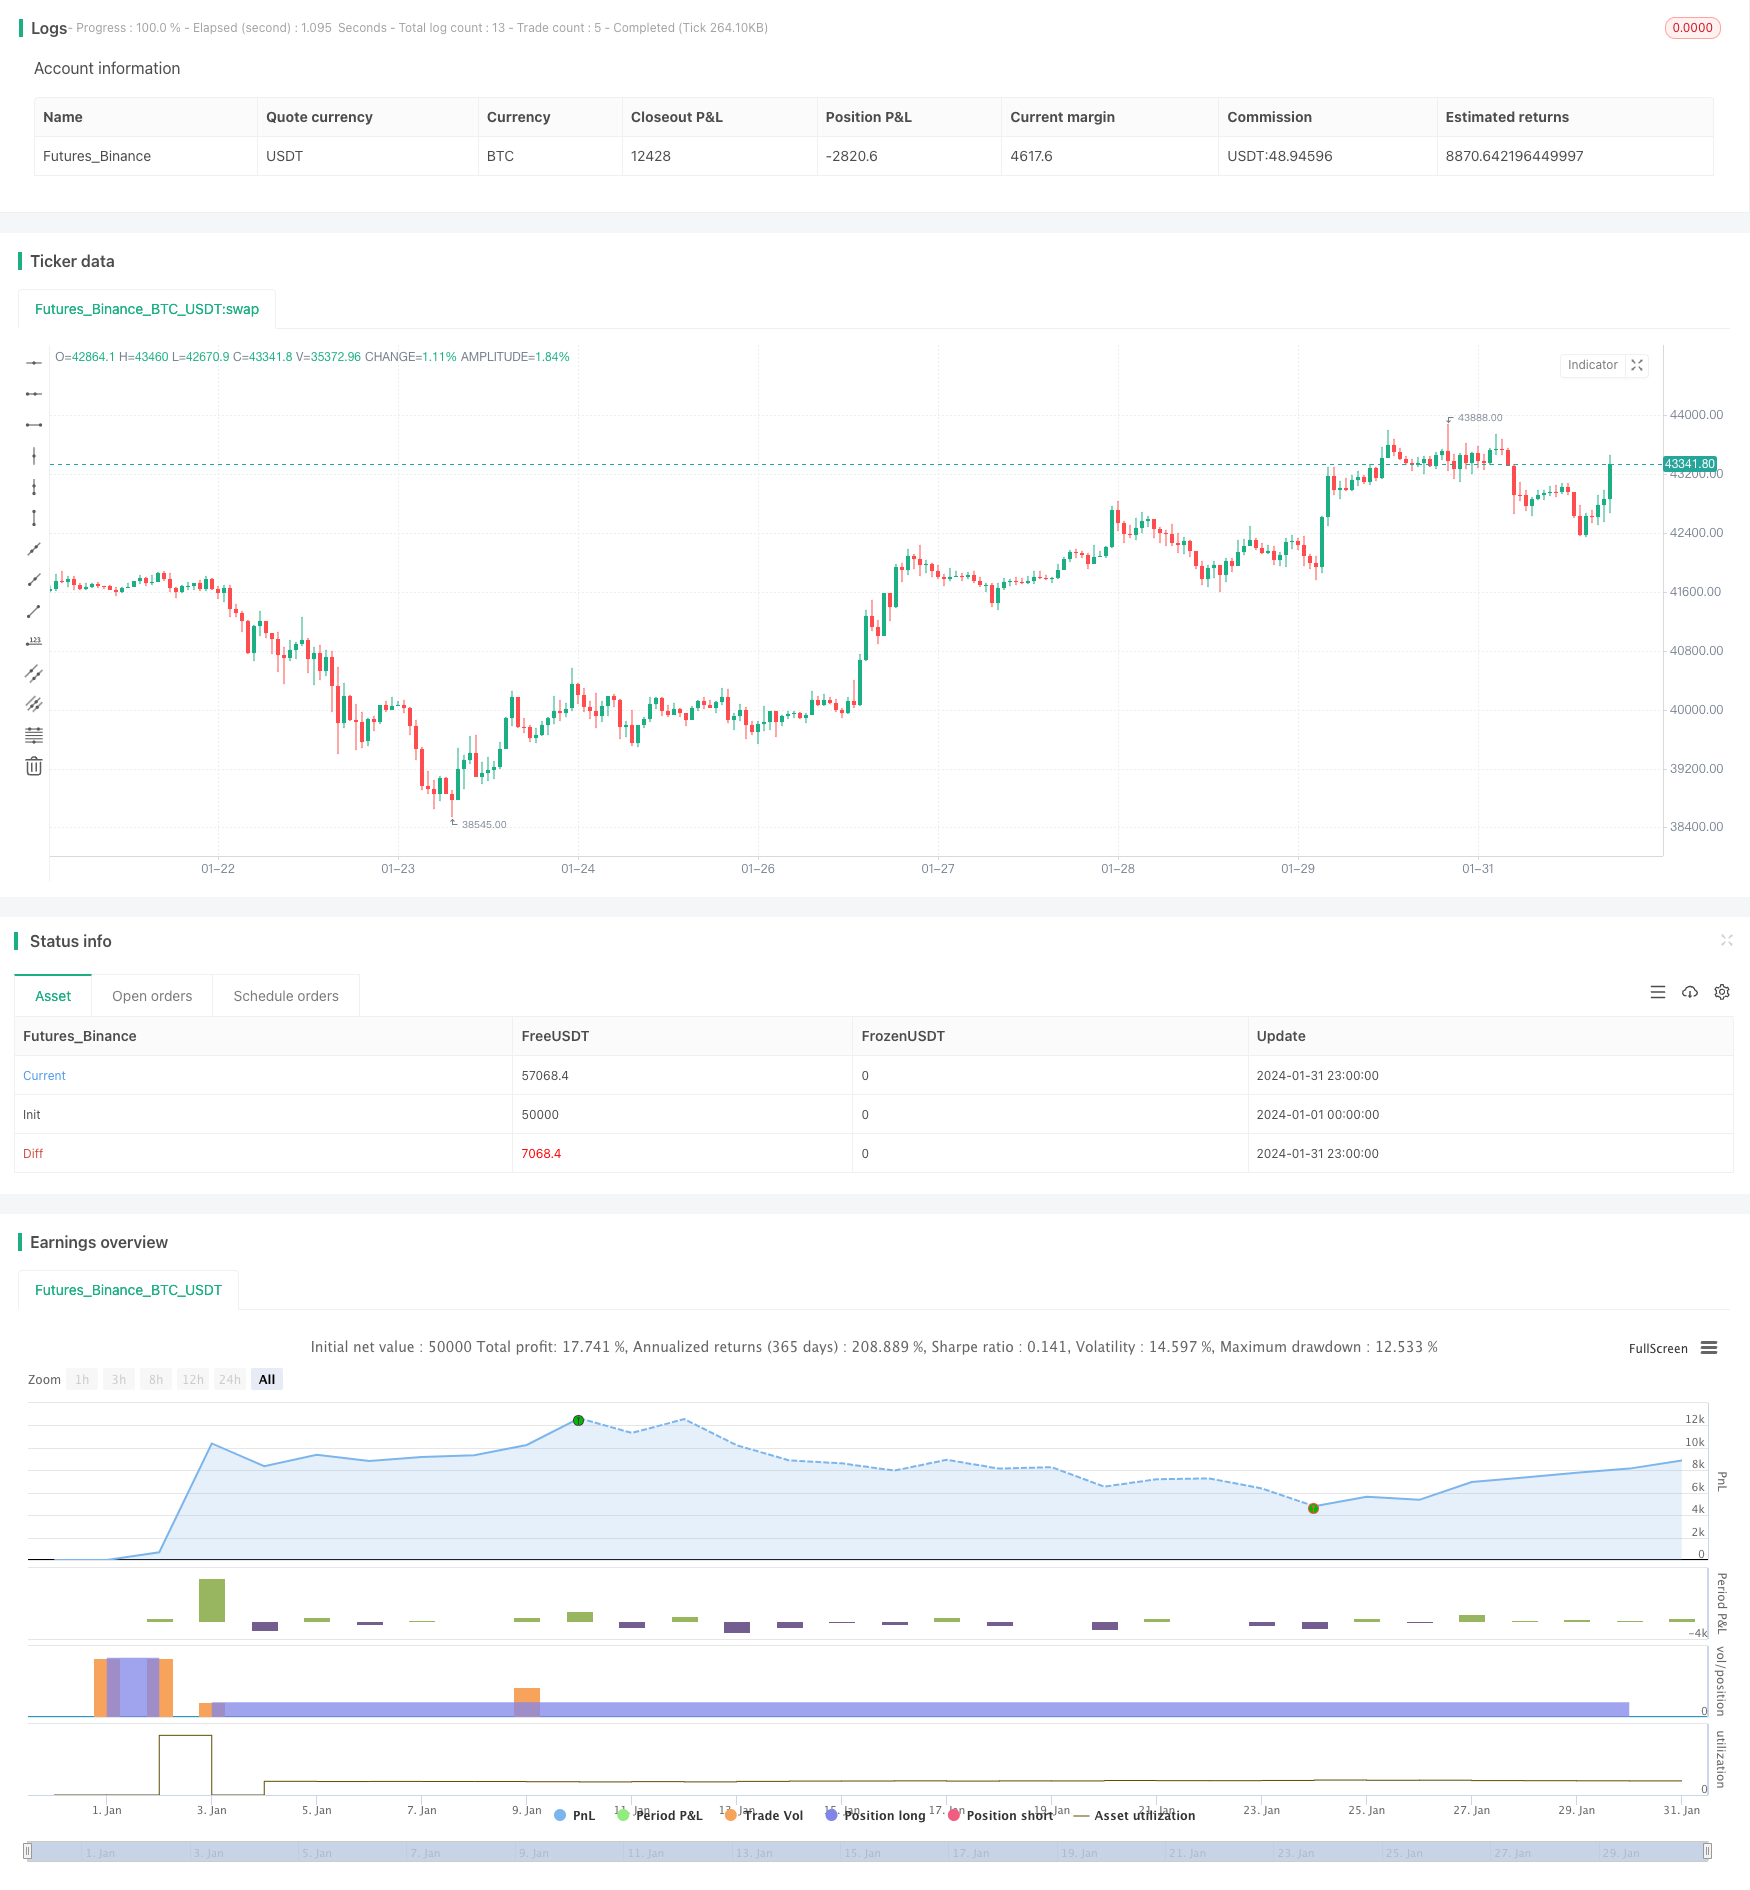
概述
本策略通过利用不同周期的均线交叉形态以及RSI指标判断市场买卖时机,实现长线持有模式。策略可以通过调整参数实时优化,适用于大盘指数的长线投资。
策略原理
本策略主要通过EMA平均线的金叉、死叉判断买入和卖出时机。同时结合RSI指标判断是否处于超买超卖状态。
具体来说,买入信号的判断逻辑是:价格下穿EMA20且上穿EMA50形成金叉时买入,这样可以更有效判断趋势转折点。此外,还要满足收盘价小于开盘价以及低于前一日最低价的条件,这可以滤除一些假突破。
我们将以上买入条件配以不同的参数,构建了4个买入规则,分别对应不同的均线周期和数量 water_level。这可以通过分批建立仓位的方式,实现数量的平均分配。
而对于卖出退出来说,判断条件则是:价格上穿EMA10形成死叉时且RSI指标显示超买信号时卖出;或价格下穿EMA10形成死叉时且RSI显示超卖时卖出。此外,还检查了满足一定盈利比例的条件。这样可以锁定盈利,同时结合RSI指标可以减少误判概率。
策略优势分析
本策略最大的优势在于通过均线的交叉形态判断市场转折点,实现趋势跟踪。与单一均线系统相比,双均线交叉法可以过滤掉一些假信号。此外,本策略还引入RSI指标判断超买超卖区域,这也可以有效降低交易风险。
另一个优势在于通过参数调节建立分批持仓,这种金字塔加仓方式可以让成本价格不断向下移位,在趋势出现时获得最大收益。同时也实现了数量的分散,降低了单笔数量的风险。
策略风险分析
本策略的主要风险在于:
均线体系本身对滞后性比较敏感,无法对突发事件做出及时反应,这会导致不能及时止损。这点风险可以通过加入止损点来降低。
本策略对买入的时间段没有限制,如果配置错误可能会过早买入,从而卡在盘整区间。这点风险可以通过限制买入区间的方式来解决。
本策略的分批建仓方式可能会导致仓位过大,无法承受单边突破的风险。这可以通过调整水位参数以及加入风控机制来降低这部分风险。
策略优化方向
本策略还可以从以下几个方向进行优化:
增加止损策略,当价格跌破某些关键支持位时止损出场,这可以有效控制下行风险。
增加交易前验证模块,判断大级别趋势方向,只有在趋势向上时才进行建仓,这可以避免逆势交易的风险。
对买入区间进行限制,只在一定时间段内才能进行加仓,避免过早打开仓位。
引入机器学习算法结合多因子判断买入时机,可以提高策略胜率。
总结
本文详细介绍了一种长线量化策略的思路,该策略运用双均线交叉形态结合RSI指标判断入场点位,并采取分批建仓的方式获得最大效率。此策略通过参数调整可以适用于大部分指数和股票,是一种较为通用的长线跟踪策略。同时也分析了该策略可能存在的风险点和后续的优化思路。相信通过不断完善,本策略可以成为一个值得长期持有实战的选择。
/*backtest
start: 2024-01-01 00:00:00
end: 2024-01-31 23:59:59
period: 1h
basePeriod: 15m
exchanges: [{"eid":"Futures_Binance","currency":"BTC_USDT"}]
*/

//@version=5
strategy("EMA_zorba1", shorttitle="3 NIFTY RSI EMA", overlay=true)

// Input parameters
qt1 = input.int(1, title="Quantity 1", minval=1)
qt2 = input.int(2, title="Quantity 2", minval=1)
qt3 = input.int(3, title="Quantity 3", minval=1)
qt4 = input.int(4, title="Quantity 4", minval=1)
ema10 = ta.ema(close, 10)
ema20 = ta.ema(close, 20)
ema50 = ta.ema(close, 50)
ema100 = ta.ema(close, 100)
ema200 = ta.ema(close, 200)

// RSI(14) condition
rsi_threshold = 65
rsi_crossed_above_70 = ta.rsi(close, 14) > rsi_threshold
rsi_crossed_above_70_two_days_ago = ta.rsi(close[5], 14) > rsi_threshold or ta.rsi(close[4], 14) > rsi_threshold or ta.rsi(close[3], 14) > rsi_threshold
rsi_crossed_above_70_yesterday = ta.rsi(close[1], 14) > rsi_threshold

// Date range filter
start_date = timestamp(year=2021, month=1, day=1)
end_date = timestamp(year=2024, month=1, day=1)
in_date_range = true

// Profit condition
profit_percentage = input(1, title="Profit Percentage")  // Adjust this value as needed

// Pyramiding setting
pyramiding = input.int(1, title="Pyramiding", minval=1, maxval=10)

// Buy conditions
buy_condition_1 = in_date_range and close < ema20 and close > ema50 and close < open and close < low[1]
buy_condition_2 = in_date_range and close < ema50 and close > ema100 and close < open and close < low[1]
buy_condition_3 = in_date_range and close < ema100 and close > ema200 and close < open and close < low[1]
buy_condition_4 = in_date_range and close < ema200 and close < open and close < low[1]

// Exit conditions
profit_condition = strategy.position_avg_price * (1 + profit_percentage / 100) <= close
exit_condition_1 = in_date_range and ((close > ema10 and ema10 > ema20 and ema10 > ema50 and ema10 > ema100 and ema10 > ema200 and close < open) and rsi_crossed_above_70_two_days_ago) and profit_condition and close < low[1] and close < low[2]
exit_condition_2 = in_date_range and ((close < ema10 and close[1] > ema10 and close < close[1] and ema10 > ema20 and ema10 > ema50 and ema10 > ema100 and ema10 > ema200 and close < open) and rsi_crossed_above_70_yesterday) and profit_condition and close < low[1] and close < low[2]

// Strategy logic
strategy.entry("Buy1", strategy.long, qty=qt1 * pyramiding, when=buy_condition_1)
strategy.entry("Buy2", strategy.long, qty=qt2 * pyramiding, when=buy_condition_2)
strategy.entry("Buy3", strategy.long, qty=qt3 * pyramiding, when=buy_condition_3)
strategy.entry("Buy4", strategy.long, qty=qt4 * pyramiding, when=buy_condition_4)

strategy.close("Buy1", when=exit_condition_1 or exit_condition_2)
strategy.close("Buy2", when=exit_condition_1 or exit_condition_2)
strategy.close("Buy3", when=exit_condition_1 or exit_condition_2)
strategy.close("Buy4", when=exit_condition_1 or exit_condition_2)