概述
该策略通过RSI指标与两条不同周期的MA均线的交叉来判断行情趋势和 entrada 入场时机。策略只在RSI高于其自身26周期均线时做多,RSI低于其自身26周期均线时做空,以控制风险。
策略原理
该策略使用12周期和26周期两条MA均线。当12周期快线上穿26周期慢线时,认为行情进入上升趋势;当快线下穿慢线时,认为行情进入下降趋势。策略在均线发生黄金交叉时做多,死亡交叉时做空。
同时,策略引入RSI指标判断超买超卖区域。只有当RSI高于其自身26周期均线时,才会在均线发生黄金交叉时开仓做多;只有当RSI低于其自身26周期均线时,才会在均线发生死亡交叉时开仓做空。这可以避免在行情被超买或超卖的情况下强行开仓,从而控制风险。
优势分析
该策略结合均线和RSI指标判断趋势和入场时机,可以有效跟踪趋势。引入RSI指标作为过滤条件,可以减少开仓次数,避免在震荡行情中被套。不设置止损,可以充分跟踪趋势达到更高收益。
风险分析
由于不设止损,如果判断错误,亏损可能会放大。如果行情出现大幅跳空,也可能造成较大亏损。此外,RSI过滤条件如果设定不当,也可能错过较好的入场时机。
可以考虑设置止损来控制最大亏损。可以适当调整RSI的参数,寻找更好的过滤条件。如果行情波动较大,可以适当调整均线的参数,使用更慢的均线来判断趋势。
优化方向
该策略可以从以下几个方面进行优化:
测试不同周期的MA均线组合,寻找更匹配当下行情特点的均线参数。
测试RSI的不同周期参数、不同的过滤条件,优化入场时机。
加入其他指标或过滤条件,提高系统稳定性。例如加入量能指标、交易量指标等与趋势判断相关的指标。
优化止损策略,在跟踪趋势的同时控制风险。可以测试追踪止损、百分比止损、动态止损等止损策略。
总结
该策略总体较为简单直接,通过均线交叉判断趋势,RSI避免强行开仓,从而跟踪趋势达到较好收益。可以通过参数优化、增加其他指标等方式进一步完善该策略,使其更适合复杂多变的市场环境。
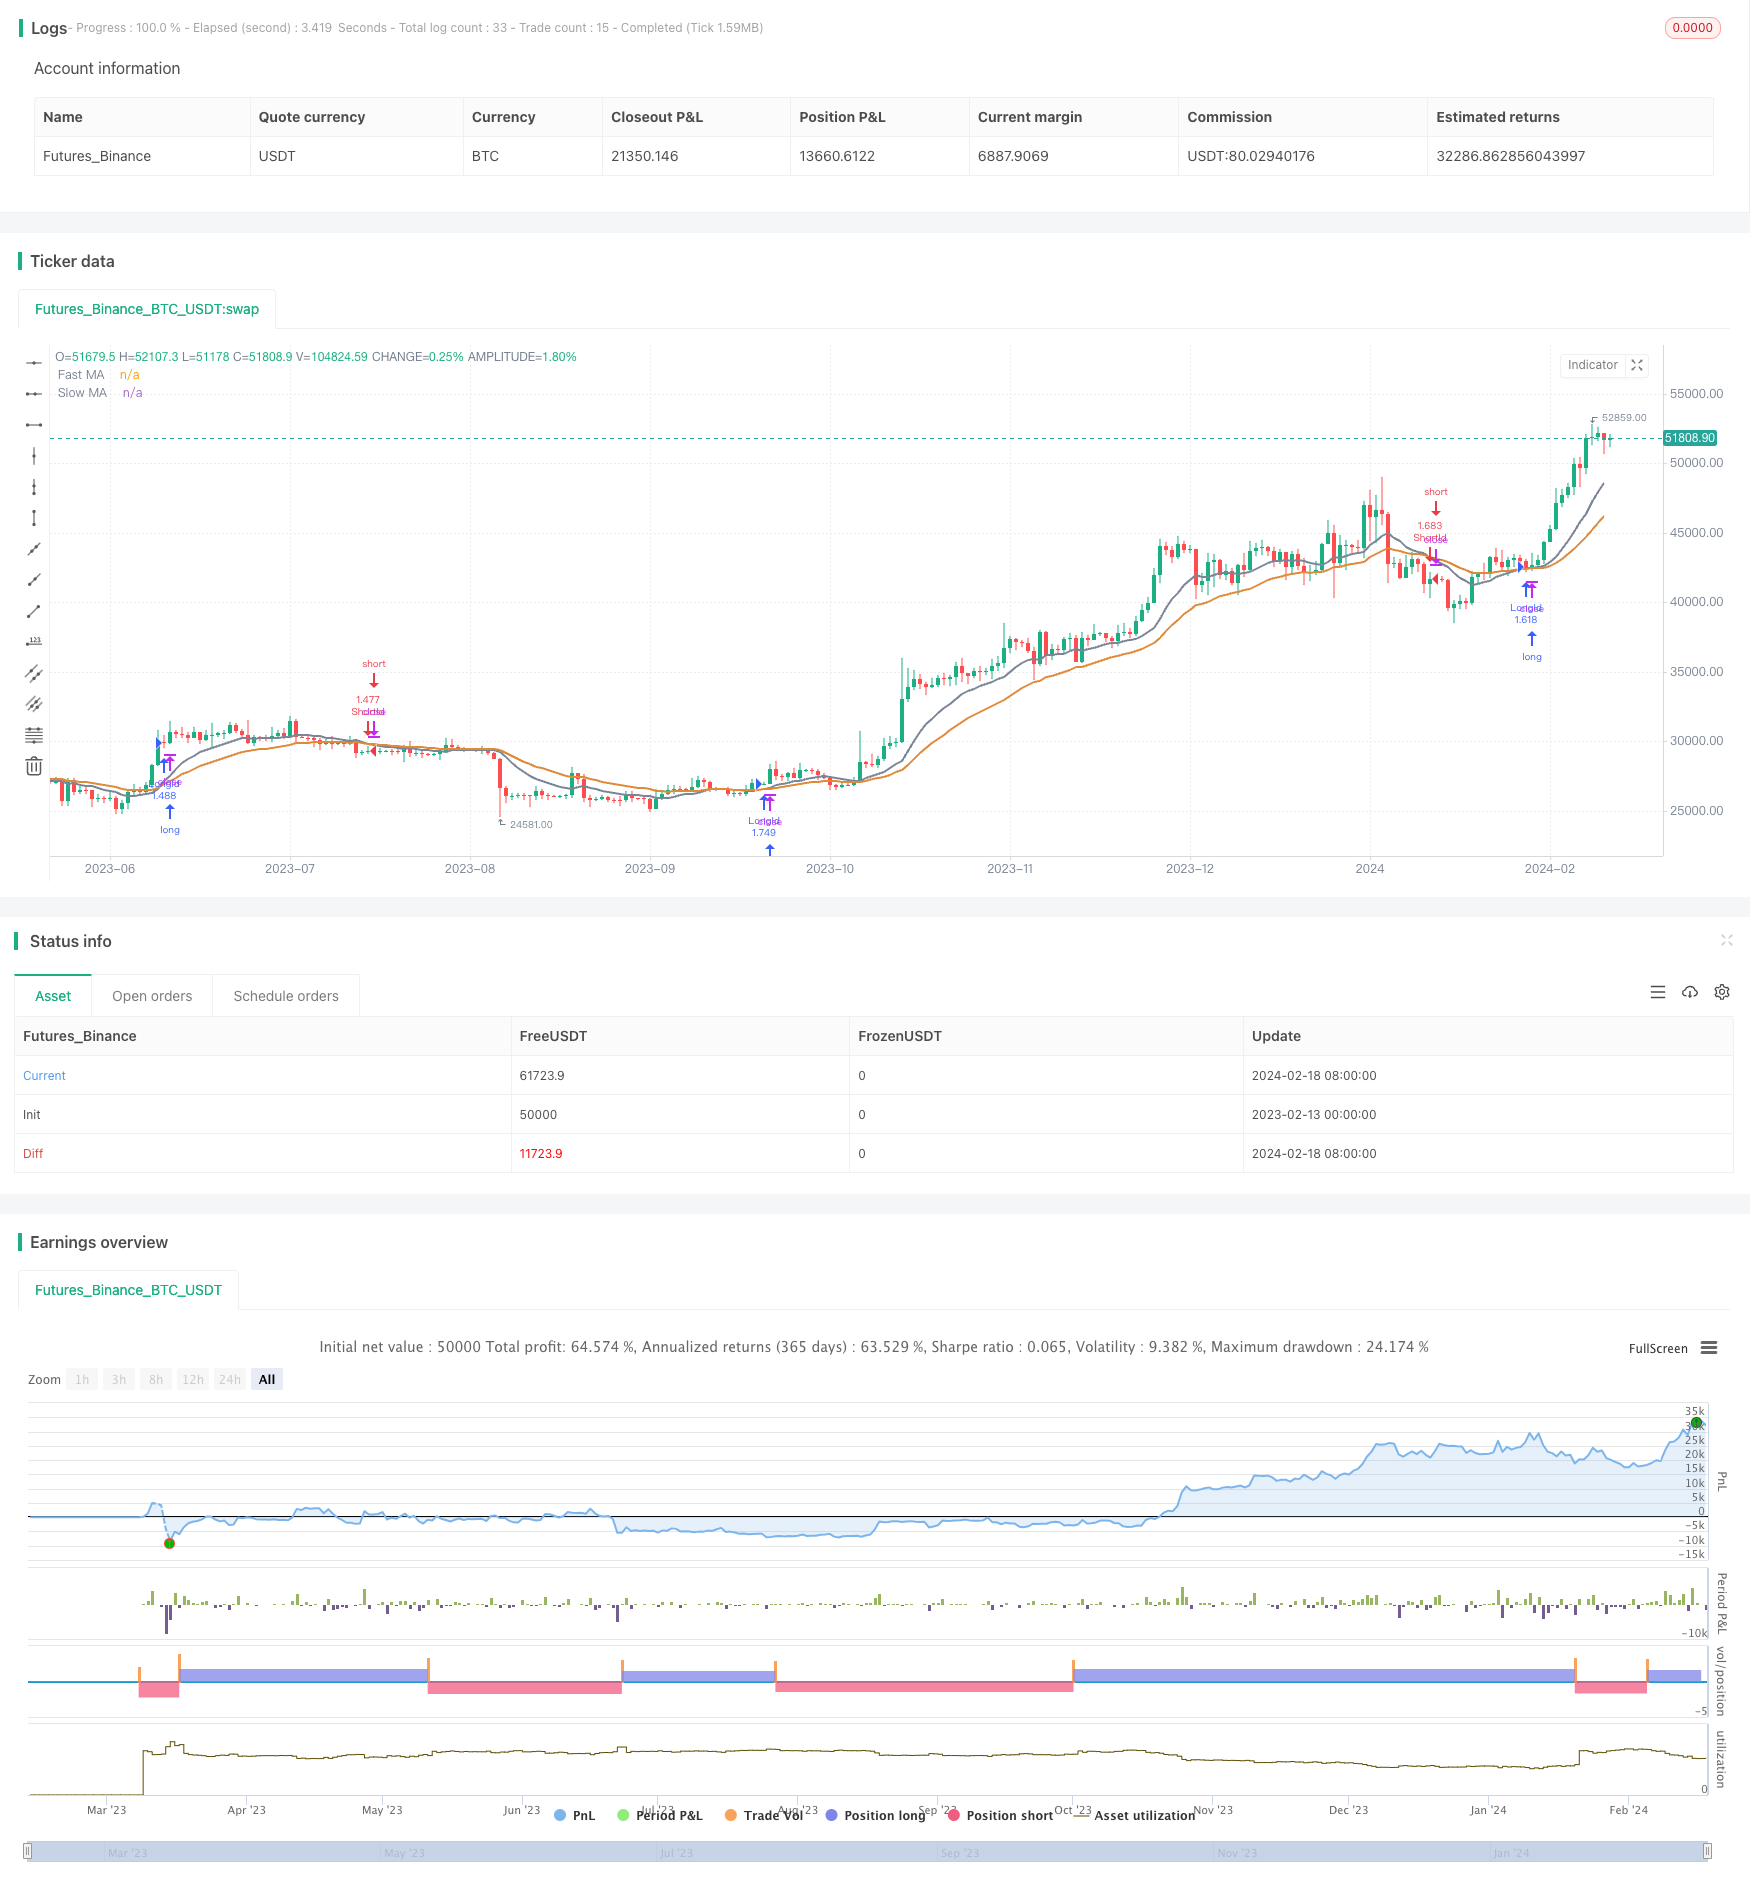
/*backtest
start: 2023-02-13 00:00:00
end: 2024-02-19 00:00:00
period: 1d
basePeriod: 1h
exchanges: [{"eid":"Futures_Binance","currency":"BTC_USDT"}]
*/

//@version=2

strategy(title = "EMA Cross Strategy", shorttitle = "EMA Cross",calc_on_order_fills=true,calc_on_every_tick =true, initial_capital=21000,commission_value=.25,overlay = true,default_qty_type = strategy.percent_of_equity, default_qty_value = 100)
StartYear = input(2018, "Backtest Start Year")
StartMonth = input(1, "Backtest Start Month")
StartDay = input(1, "Backtest Start Day")
UseStopLoss = input(false,"UseStopLoss")
//rsiLong = true
rsi1 = rsi(close, 14)

window() => true

stopLoss = input(20, title = "Stop loss percentage(0.1%)")
//stopLoss = input(200, title = "Stop loss percentage(0.1%)")

maFastSource   = input(defval = open, title = "Fast MA Source")
maFastLength   = input(defval = 12, title = "Fast MA Period", minval = 1)
// long ma
maSlowSource   = input(defval = open, title = "Slow MA Source")
maSlowLength   = input(defval = 26, title = "Slow MA Period", minval = 1)

maFast = ema(maFastSource, maFastLength)
maSlow = ema(maSlowSource, maSlowLength)

//12 and 26=9%; 3 and8=2%; 26 and 55=2%; when selling on a cross under
//maFastRSI = ema(rsi1, 12)
//maSlowRSI = ema(rsi1, 26)

fast = plot(maFast, title = "Fast MA", color = #7a8598, linewidth = 2, style = line, transp = 50)
slow = plot(maSlow, title = "Slow MA", color = #e08937, linewidth = 2, style = line, transp = 50)


longEMA = crossover(maFast, maSlow)
exitLong = crossunder(maFast, maSlow) // 5% in 2018
//exitLong = crossunder(close, maFast) // 15% in 2018
//exitLong = crossunder(rsi1, maFastRSI) // 13%

shortEMA = crossover(maSlow, maFast)
exitShort = crossover(maFast, maSlow)

//if (rsi1 < ema(rsi1,7))
//rsiLong = false

//if (longEMA and (rsi1 >= highest(rsi1,10)))
//if (longEMA)
if (longEMA and (rsi1 > ema(rsi1,26)))  //RSI ema values optimal from 19 to 35
    strategy.entry("LongId", strategy.long, when=window())

//strategy.close_all(when = rsi1 > 60) // 80=26%, 90=n/a, 70=15%, 60=16% long only
//strategy.close_all(when = (shortEMA and (rsi1 <= ema(rsi1,26)))) //10% gain in 2018 long only
//strategy.close_all(when = (rsi1 <= ema(rsi1,120))) //26=17% 14=2% 42=15%
//strategy.close_all(when = (shortEMA)) // 5% gain in 2018 long only
//strategy.close_all(when = exitLong)

//if (shortEMA and not(rsiLong))
//if (shortEMA)
if (shortEMA and (rsi1 <= ema(rsi1,26)))
    strategy.entry("ShortId", strategy.short, when=window())

if (UseStopLoss)
    strategy.exit("StopLoss", "LongId", loss = close * stopLoss / 1000 / syminfo.mintick)
    strategy.exit("StopLoss", "ShortId", loss = close * stopLoss / 1000 / syminfo.mintick)